
Table of Contents
- What Is the Importance of Infographics?
- How to Make an Infographic in 7 Steps
- 5 Best Infographic Templates to Try Out
- Key Takeaways
- Conclusion
- FAQs
If you want to enrich your content and add a good user experience to your page, using infographics can be a great idea. They are an essential part of a content marketing strategy and can help your audience navigate the content with ease. Although you cannot let go of text completely, you can always supplement it with some informative graphics.
If you don’t know how to create infographics, fret not! There are numerous free tools available on the internet that you can use to make an infographic for your text, and that too, without a designer. Moreover, this guide is there to let you know everything that it takes to create infographics. Keep reading.

What Is the Importance of Infographics?
An infographic is a visual representation of information that adds more value and flavor to the written text. It is mainly used to educate the audience before introducing a product or service to them.
However, infographics don’t necessarily need to have numbers, as people often think. To create infographics, all you need to do is group the relevant information in a way that makes it easier for the audience to comprehend the topic. Here are some types of infographics you can use according to your requirements and buyer persona.
1. Interactive infographics
With clickable links, timelines, menus, etc., these infographics allow users to interact with the content. They are visually attractive and user-friendly.
2. Static infographics
Static infographics usually comprise short text and an image. They are suitable to pass on both simple information and complex concepts. However, with this design, you need to guide the consumers’ reading to help them comprehend the message completely.
3. Animated infographics
As the name suggests, animated infographics comprise animated videos and GIFs, which are moving pieces. It is ideal to use them for complex topics and articles that are likely to be shared more. Because animation requires coding language, these infographics are comparatively more technical.
Infographics put life into your content and help you attract a larger audience. Graphics are tempting, and when you combine them with informative text, they only improve engagement, thereby playing an essential role in your marketing technique.
How to Make an Infographic in 7 Steps
This section lists a few key tips to create infographics.
1. Identify your target audience
If you want to sell your design, you need to find an audience that is trying to consume the content that is relevant to your infographics. Analyze who would really read your content. What problems are they facing, and what information are they seeking through your blog? Create relevant content that adds value to your readers’ lives.
2. Gather your data
As you take the next step towards how to make an infographic, collect your data while bearing in mind the story you want to convey using the information. Unless it is relevant to the context, it won’t make sense to create an infographic. To make your data comprehensive, provide your audience with proper context.
3. Organize your content
Once your audience is defined, gather and organize all the content and data you are going to use in the infographic. Bear in mind that your sources are relevant to what you want to pass on to your readers.
4. Cite your sources
The best way to cite your sources and keep your infographics organized is to add a URL that links to your website page, below the infographic. You can also list all the statistics and their sources, such as a web page with the full listing, used in the infographic.
This way, your infographic will not only look clean and professional, but it would also make it convenient for users to access the source irrespective of where it is shared. What’s more? It can even drive traffic back to your website.
5. Choose a suitable infographic template
The next step is to select one from among the best infographic templates that appropriately represent your data. It is advisable to pick a template that matches the type of content or story you need to present.
This is probably the most time-consuming part of learning how to create infographics. But it can be a cakewalk if you do it right. Download your desired infographic template, and insert your data along with a catchy title. Adjust the font size, and change the font style and color. You can also customize your chosen infographic by changing the graphics within it or adding some other visual elements as per the requirement.
6. Include a footer with your details
One of the benefits of making infographics is that they are shareable. Include a link to your brand’s “About” section and logo, so the audience knows who created the infographic. It is especially useful when it is shared via social media or embedded on other websites.
7. Publish it with an embed code
Now, you are ready to share your awesome infographic. Publish and promote the infographic using your blog. Do include your list of sources and add an embed code for people to share it on their websites and social media handles.
5 Best Infographic Templates to Try Out
Here is a list of a few infographic templates to choose from.
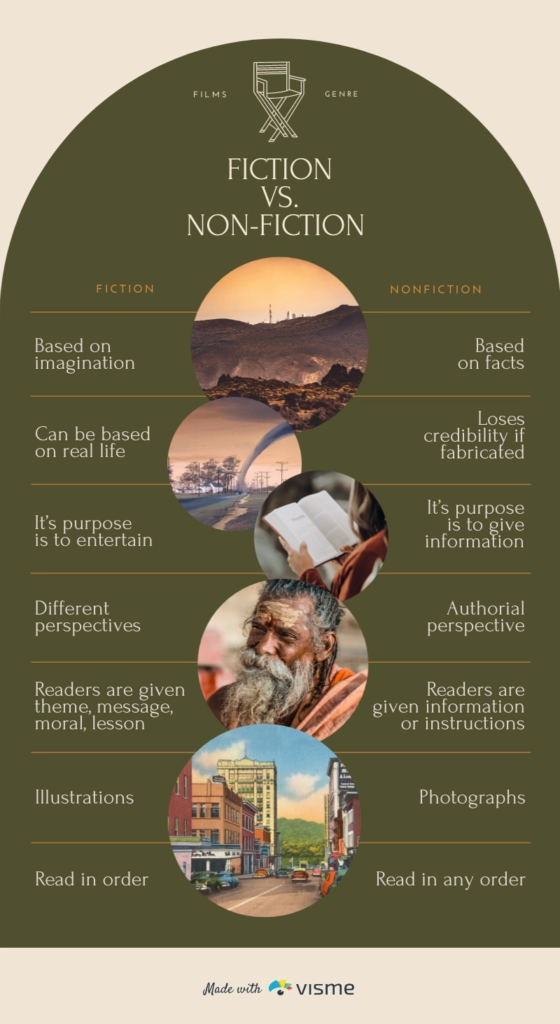
1. Comparison infographic
This type of infographic can help you explain the difference between two entities. It can also help prove what advantage one has over the other.
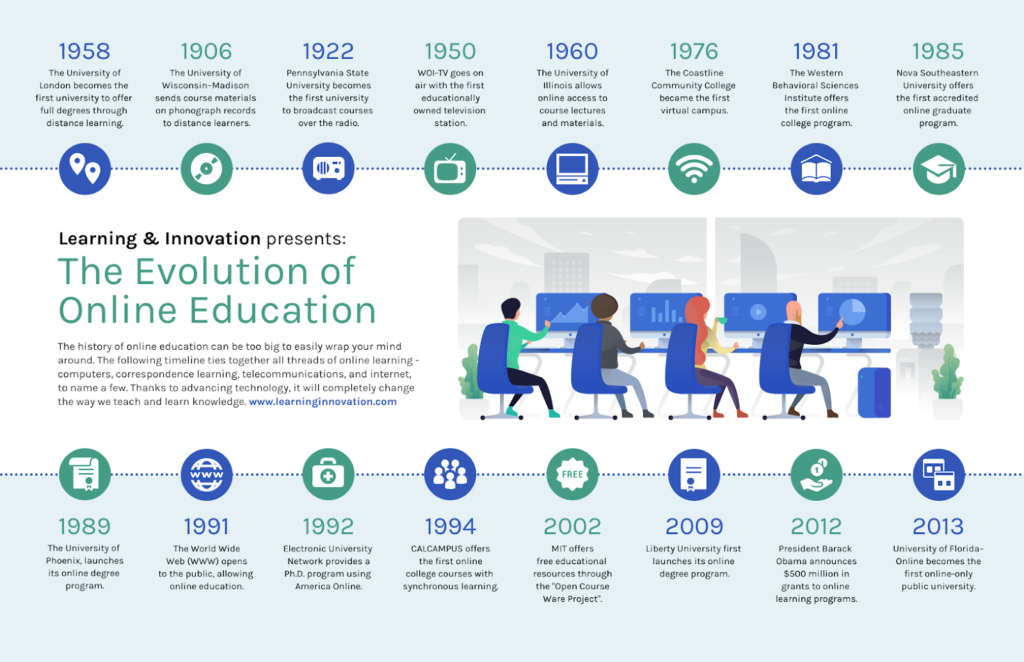
2. Timeline infographic
Through this type of infographic, you can dive into the history of a product. You can even tell a chronological story of a product, business, or industry.
3. Image-heavy infographic
If you are a content creator or marketer, you may want to reveal trends and information via interesting photographs rather than using just figures and numbers. This is when you can use an infographic that contains images.
4. Graph-based infographic
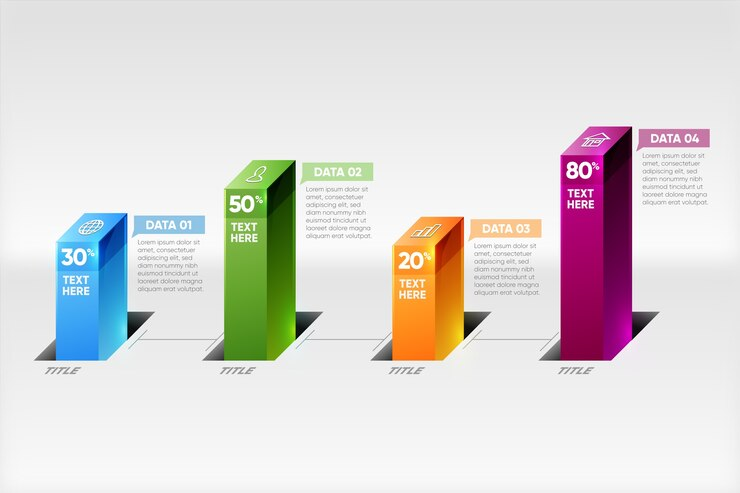
This design works well if you have a high volume of data to publish. Infographics with graphs help simplify information and make it consumable for the audience.
5. Flowchart infographic
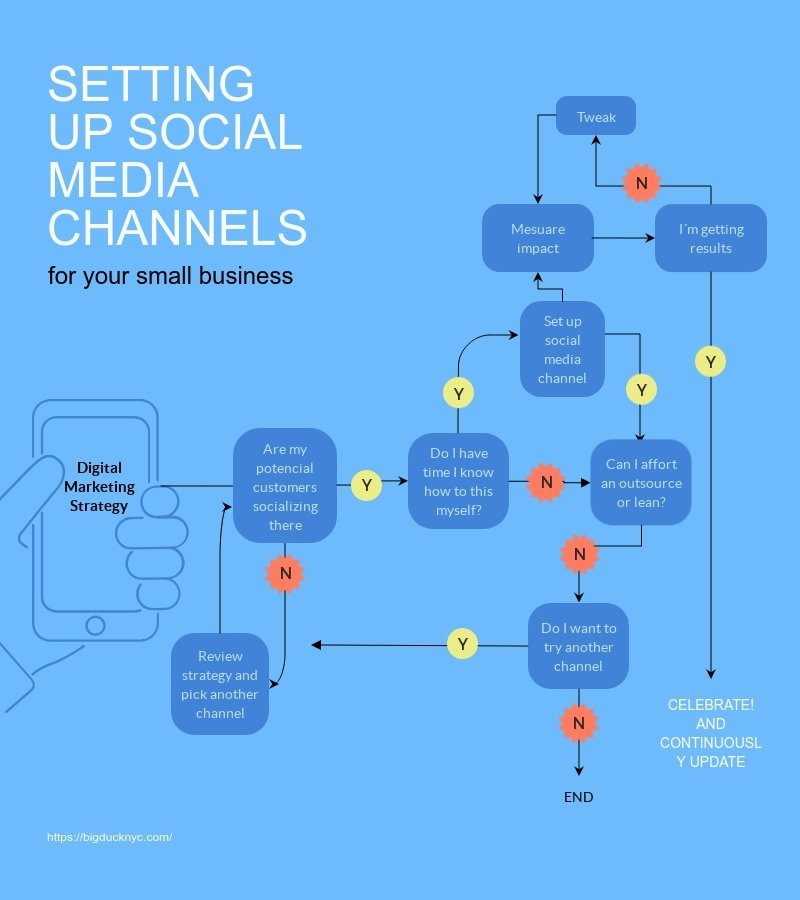
This is one of the best infographic templates. It is often used to represent a cyclical or linear process to disseminate information: for example, a new workflow of an organization.
Key Takeaways
- Besides fonts and colors, there are other factors that might impact your users’ experience and improve the performance of your content.
- Before you create an infographic, consider the mindset of your consumer.
- Create an infographic that adjusts to different screen sizes to ensure it is legible on any device.
- Try not to generalize your information. You cannot target everyone with one infographic. So, try to narrow down your audience base, and avoid the clutter.
- Always consider how your consumers will navigate the content. You can add visual cues, such as numbers or arrows, to guide users’ attention. It can help you convey your story effectively.
- Avoid treating your infographics like articles. Do not overload them with information; keep the text to a minimum and use attractive visuals. Vast chunks of text in an infographic may scare the audience off.
- Include your website URL and brand logo in the infographic, and get your work recognized. You may also add a color scheme that matches your website.
Conclusion
Infographics are a type of content that can be easily created and consumed. If you don’t know how to create infographics and have been considering hiring a designer, it is recommended to try out the above tips to create infographics first.
Just keep in mind the crucial points, and you can make an infographic in less than an hour using a free tool. The best part is you can use these infographics for different purposes: to attract leads, propose a sale, or even nurture a relationship with your stockholders.
FAQs
Many free infographic tools, such as Canva, Piktochart, and Visme offer free infographic templates. With these tools, you can create an infographic without possessing any design skills. Just sign up, follow the prescribed steps, and you’re good to go.
1. Go to Canva, select a template, and customize it with your content.
2. Once it’s ready, click on the “Download” button above the editor.
3. In the dropdown list, pick a file type for download.
4. Click on “Download” to complete the process.
Yes, Canva is free to use. But you need to upgrade to Canva Pro (which is a paid version) to access premium tools and content.
If you are publishing content or running an online business, you cannot have it take off without SEO. And, infographics help you earn precious backlinks to boost your website SEO. They also help make your content more consumable.
If you do not have access to infographic design applications, Microsoft Word can help you too. Just click on the “Charts” option under “Insert.” In this manner, you can create different charts for your design
Latest Blogs
In this blog, explore the golden rules of using AI marketing tools so you can leverage the benefits to their maximum potential.
In this blog, you’ll learn how to avoid the pitfalls of SEO over-optimization while enhancing your site’s performance.
In this article, we’ll take a look at what AMP is, its advantages and disadvantages, and how it affects SEO.
Get your hands on the latest news!

Similar Posts

Design
7 mins read
15 Best Firms Offering Design Services in India

Design
5 mins read
All You Need to Know About Data-Driven Design

Design
6 mins read