10 Infographic Design Templates for a Marketer in a Hurry

Table of Contents
- What Are Infographics?
- Why Should You Use Infographics?
- The Anatomy of a Good Infographic
- 6 Tips to Design an Infographic
- 3 Examples of a Great Infographic
- 10 Best Infographic Templates to Seek Inspiration From
- Key Takeaways
- Conclusion
- FAQs
Who wants to waste time reading and trying to decipher pages and pages of difficult text? It’s no coincidence that pictures or creatives make up most of what we consume online these days. There is simply a lot of information around us for us to remember it all in a short period of time. There is no doubt, however, that employing infographics to convey figures and facts helps us understand and retain that information better (it is no surprise, then, that the internet is flooded with infographic design templates.)
Today, a majority of content marketing professionals in both B2B and B2C industries use content such as infographics and other visuals as a strategic tool. In fact, infographics have significantly become popular among B2B marketers over the last four years, with their usage being at 67% in 2020. In this blog, we will share with you all that you need to know about creating good infographics, along with ten infographic design templates for inspiration.

What Are Infographics?
Infographics are visual representations of information, facts, or data used to rapidly and clearly explain complicated information. Graphics are known to enhance cognition and help us understand complex information easily.
Infographics are primarily used to convey a story; they aid in organizing complex data in a way that it becomes easy and interesting for readers. In the form of a graph or a picture, infographics present huge volumes of data and information easily. They’re employed for a variety of reasons: they’re interesting, concise, and all of the information contained in them is easily digestible by the reader, making them valuable.
Infographics are an important way of visually communicating crucial information to audiences. They are a great way to structure and organize information seamlessly.
The one thing that separates infographics from other forms of content is that apart from providing information, infographics also make the content fun, engaging, and more palatable. Here are a few ways in which they can help your overall content strategy.
- They enhance the shareability of the content.
- They help you get high-quality backlinks.
- They make complex information more digestible and consumable.
- They can be an effective means to tell a story.
Why Should You Use Infographics?
Now that we understand what infographics are, let’s understand why and when you should use infographics in your content marketing strategy.
Do you belong to an industry that has to present data and information to stakeholders on a regular basis? Then infographics are an excellent fit for you. According to studies, 90% of the information that is retained by the brain is visual.
Because they can be visually appealing, infographics can be used to boost brand awareness and even create a brand identity. And thanks to their easy scannability, they can attract more readers to your content, which means more traffic to your website. Below, we list a number of benefits of using infographics.
1. They’re an effective way to tell stories
Making successful infographics entails gathering relevant data, writing captivating text, and presenting it in a timely and visually appealing manner. Infographics make it easier to cover complex topics in a fun, light way. Visual cues, according to research, aid in the memorization of information. As a result, infographics help you create an imprint of your tale in the minds of your viewers.
2. They establish you as an authority
A majority of people find numbers and stats impressive, but when these numbers are combined with images, it’s a match made in heaven. You’re not only portraying yourself as an expert when you share your expertise through an infographic, but you’re also improving the credibility of your brand.
The time, effort, and experience required to make a captivating infographic can make it seem like a daunting task, but it’s well worth it in the end. Readers will value your increased knowledge and regard you as an authority the next time they come across similar topics on the web.
3. They increase traffic to your website
Your website will inevitably receive more visitors when you publish infographics that are eye-catching and interesting. Every like, comment or share means that more people will view your content, and share it in their own networks.
However, like with other content pieces, it’s what you do with it, how you create it, and where you share it that determines your infographic’s capacity to drive additional traffic to your site. Make sure you construct the infographic with clear objectives in mind. And don’t forget to check if you’re using the correct keywords.
Make sure you know everything there is to know about your buyer persona, as well as how you want to distribute the infographic. Are you planning to use it on a referral site? Will you be using social media to promote it? What social media platforms are you planning on using? Are you going to send it to all current prospects and customers, or just a select group of the target audience? If you answer these questions before you create the infographic, it will definitely get you better results.
4. They are memorable
What good is amazing content if people forget what they’ve read seconds after they’ve finished reading it? Visuals are known to be absorbed 60,000 times faster than text, and 65% of individuals are visual learners, making infographics one of the most effective ways to convey information to readers.
If you use infographics wisely, your readers will be able to scan the material quickly, grasp the message you’re trying to convey, and retain it long after they’ve left the page. Additionally, infographics are particularly useful when you have a complicated idea at hand. They help swiftly and easily explain the story the data exposes. Even the most inexperienced reader can understand the message through a well-crafted infographic and does it swiftly.
5. They’re easy to measure
Finally, infographics are simple to monitor and analyze. It is easy to monitor and track the effectiveness of your infographic, and assess whether it was successful. It can also help you gain insight into the types of material your users prefer, which will aid the success of future infographics.
Infographics have key metrics to measure, just like other content forms. If the infographic is gated, you’ll want to keep track of how many people click on the call-to-action (CTA). Views to the relevant landing pages should be tracked, followed by conversions.
You should track social media shares of the material as well as individual landing page clicks from a range of off-site sources, such as referring pages and social media sites. Overall, your content strategy should include a range of content forms, but infographics must be a top choice if your readers are accustomed to receiving and absorbing information in this manner.
The Anatomy of a Good Infographic
While there are many types of infographics, there are some elements common to any interesting and effective infographic. They are as follows.
1. Well-written title and subheads
Infographics offer long or complex data in a visually appealing manner, making it easier to understand. Include a descriptive title and subheads, like the ones on this creative infographic. They not only break down information into more consumable chunks but also make the overall piece scannable. Also, using a title and subheads gives a structure to the infographic.
2. Relevant statistics
The “info” in the term “infographic” stands for informative material. Make sure your data is useful, relevant, and, of course, correct. All information should be attributed to the sources from which they were gathered. Conduct extensive research for your infographics, and make sure the sources you use are credible and reliable.
3. Appropriate color scheme
Choose a vibrant color palette that aligns with the message you’re attempting to convey. Infographics should elicit a specific emotion, in addition to communicating information. If your infographic is about exciting information, for example, don’t use dismal hues. Here’s a good example.
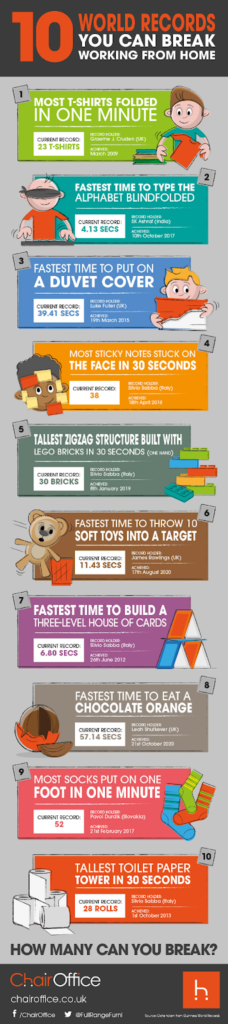
The above infographic uses a fun tone to convey information that may otherwise sound boring. To complement it, it features the usage of vibrant colors.
4. A coherent story
People don’t want to merely scroll through a cluster of information that they can find through a Google search as well. They want to be immersed in a fascinating story. Infographics should be well-structured and purposefully organized, enabling the audience to absorb the information in its right context.
5. Visually appealing graphic elements
Infographics should be visually appealing in addition to being engaging and instructive. After all, you’re vying for the attention of a digital audience that has a plethora of options for finding and consuming content. Make sure yours is one of a kind. There are many free infographic templates that can help you come up with a catchy and unique infographic of your own.
6 Tips to Design an Infographic
It’s not difficult to create an effective infographic design; all you need is basic awareness of the best practices in the field. Apart from taking cues from various infographic templates, you can also follow these tips to design an eye-catching infographic.
1. Find the right resources
Before you begin developing your own infographics, look for materials that can assist you in the process. This is especially useful if you don’t have the means to hire a professional designer.
To make your job easier, you can use various pre-designed infographic templates. In truth, there are plenty of design tools available, including reports, charts, graphs, etc. As per your budget and requirements, there are a variety of options to choose from, each with its own set of benefits and a few drawbacks.
2. Understand your buyer persona
If you don’t create a marketing asset for the right buyer persona, you won’t get the results you want. Remember what marketing is all about: sending the right message to the right audience, at the right time. In order to create an infographic that is relevant and widely shared, you need to find out certain details about your target audience, such as their occupation, purchasing habits, likes and dislikes, and more.
3. Find a story
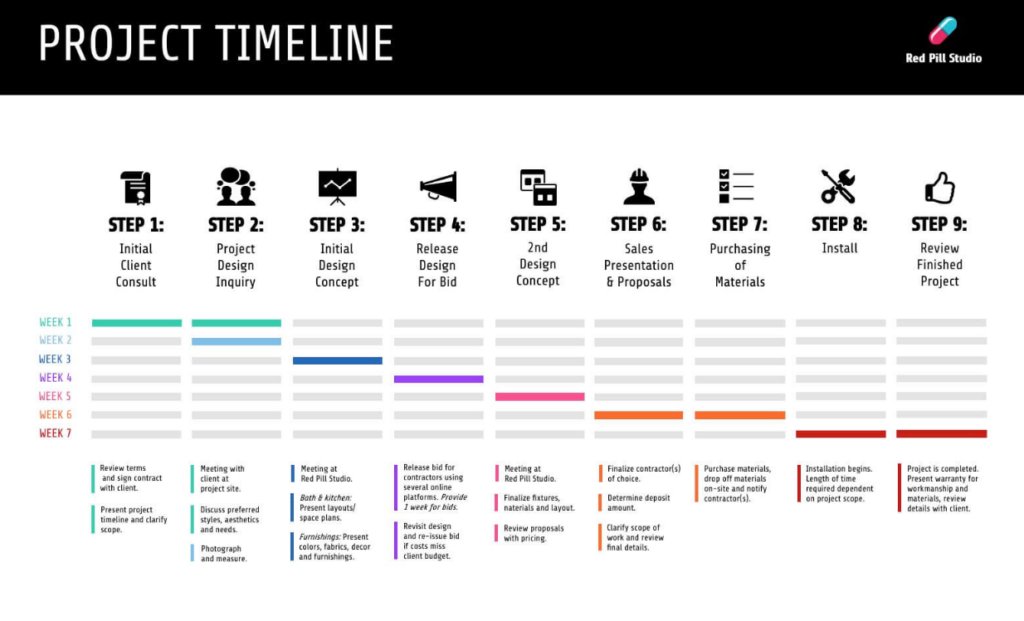
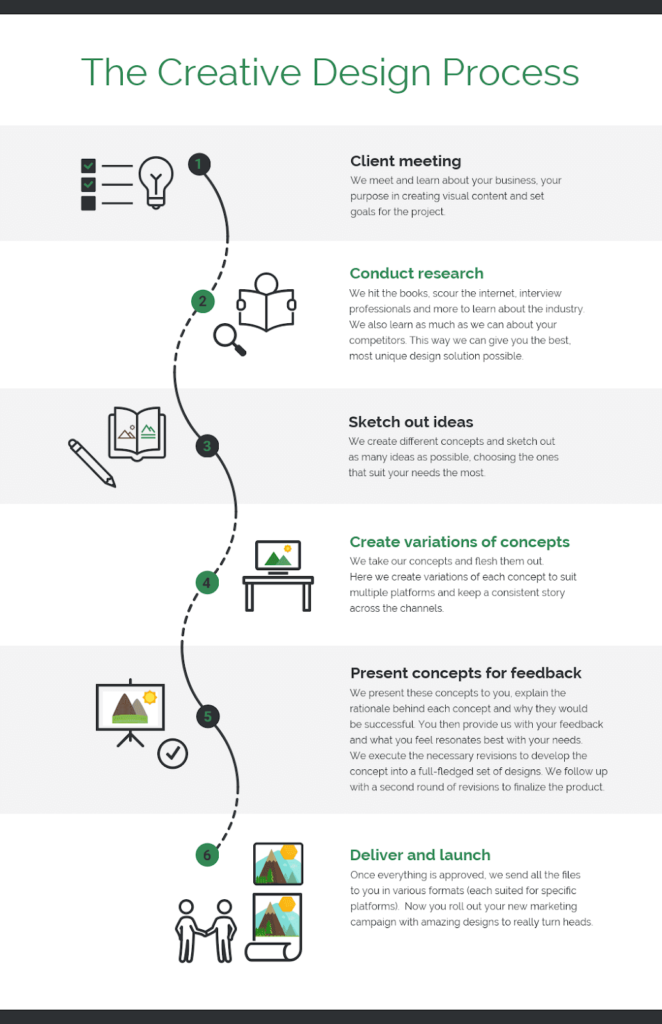
There’s a narrative in any set of data. Consider the tale you want to communicate before you start building your infographic. The information you include will be determined by the perspective you choose. For instance, the following infographic depicts the process of finishing a project from beginning to end. The information contained within it is concise, yet detailed. And the colors used help enhance its readability.
4. Keep it simple
Infographics are a terrific method to keep focused on the key information and deliver a point using simple language. The most effective messages are short and targeted at a certain audience. As a result, an infographic must be as concise and straightforward as feasible. It’s critical to use simple messaging as a marketer, wherever possible. Simple messages are easier to comprehend and remember.
5. Use contrast
By juxtaposing two starkly dissimilar components, you can create a lasting visual impact. Our eyes are drawn to the vivid colors of an infographic with a light background and bold-colored shapes.
Contrast enables you to organize data by making one element stand out more than another. For example, you can use contrasting colors to make the titles and subtitles stand out. A darker blue combined with a brighter hue, such as orange, is a great choice for making your title pop out.
6. Make sure the design is consistent
The design elements in your infographic must be consistent from beginning to end in order for it to flow. For example, if you’re utilizing filled-in icons rather than line art ones, make sure to preserve that throughout the design.
The same can be said for the image style, typeface style, and color palette you use. This will keep your infographic from seeming cluttered. In order to create an infographic that makes a mark, you have to ensure there is uniformity in your design. You can take the help of various infographic design templates online for this: you can check how these infographics fare in terms of consistency, and recreate that in your own piece (albeit, with an original spin).
3 Examples of a Great Infographic
To give you some inspiration, let’s take a look at three examples of extremely well-designed infographics.
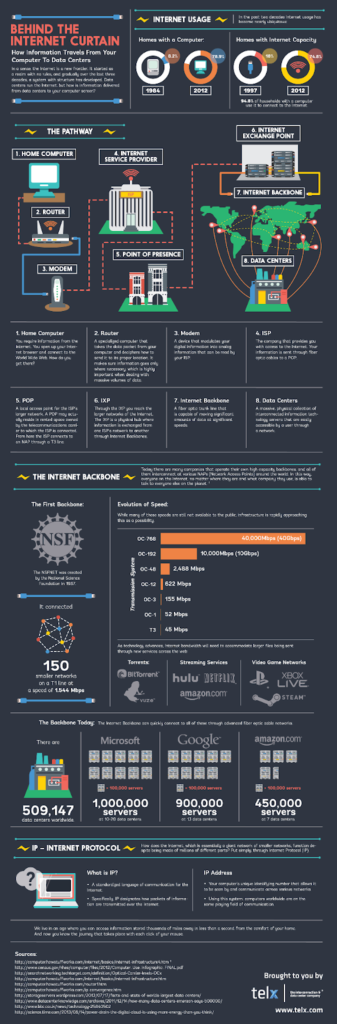
1. Behind the Internet Curtain
This infographic by Telx, a teleconnection provider, is the first on the list because it shows how effective white writing on non-black, dark backgrounds can be. At times, a black-and-white combination can be too harsh on the eyes, and it can even be deemed uninteresting. The use of a dark tint with white font makes the text easy to read.
Apart from the color palette, it is the level of detail that has gone into making this infographic that makes it stand out. It features several sections, each of which explains different aspects of how information is transmitted from computers to data centers.
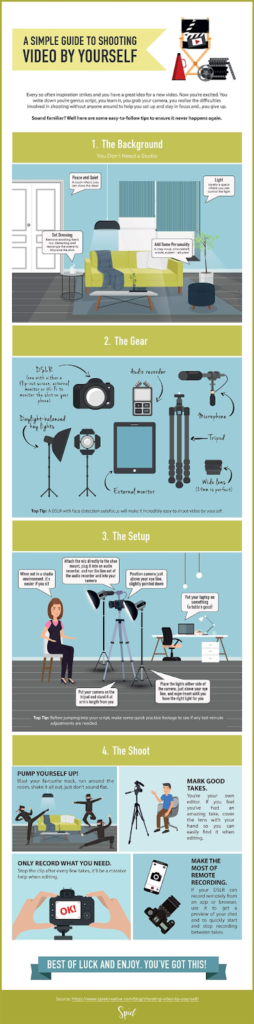
2. A Simple Guide to Shooting Video By Yourself
Despite the fact that 86% of businesses employ videos as part of their marketing plan, few know their way around videos. Videos frequently don’t come out well due to background noise, poor lighting, or some other distraction. This infographic designed by Spiel Creative has all of the information you’ll need to make amazing videos on your own.
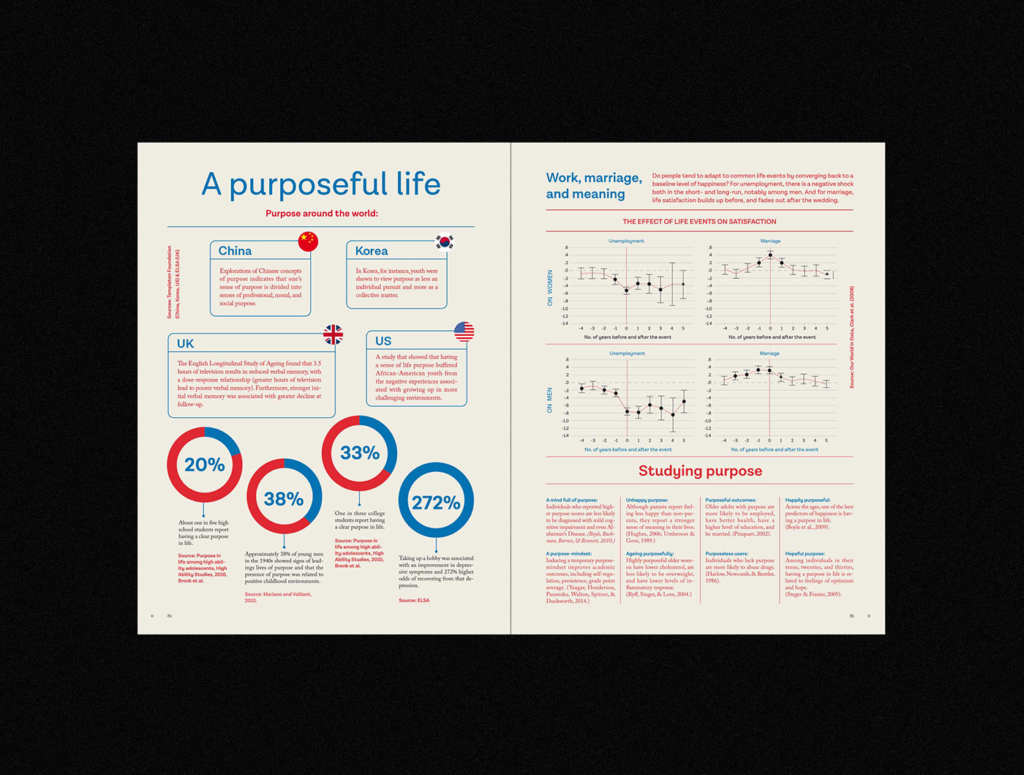
3. A Purposeful Life
Studio Patten’s free infographic compiles various survey results on purposeful life and displays information in visually appealing infographics. Although the concept of living a purposeful life is complex, this infographic does an excellent job of simplifying the facts. In addition, the usage of text and data visualization elements is well-balanced.
While your infographics may not look exactly like others on this list, make sure they’re bright and entertaining. Most importantly, the infographics must convey information in an easy-to-understand manner.
10 Best Infographic Templates to Seek Inspiration From
Infographics are a strong tool for attracting the attention of your target audiences, as you may know by now. However, designing infographics from scratch is not everyone’s cup of tea. This is especially true if you don’t have a graphic designer to do the job for you.
We understand your plight all too well. That’s why we have curated for you a list of completely customizable infographic templates that will provide you with the inspiration and foundation you need to create your own infographics.
These infographic templates can be used to show statistics at your next meeting, advertise on social media, or enhance your next blog post. Graphical information is becoming increasingly popular, and you now have the tools to generate it quickly and easily. Listed below are some of the most common infographic design templates you can use for your next project.
1. Product/service comparison template by GraphicMama
The first infographic template we’d like to share is for contrasting two concepts, products, or services. It’s ideal for contrasting information, in order to highlight the differences or demonstrate similarities within it.
As a result, the design is adaptable, allowing you to personalize it by changing the text or inserting your own images in the image placeholders. The infographic provides a framework for comparing your information across five categories, based on different criteria, such as usage, satisfaction, or specifications
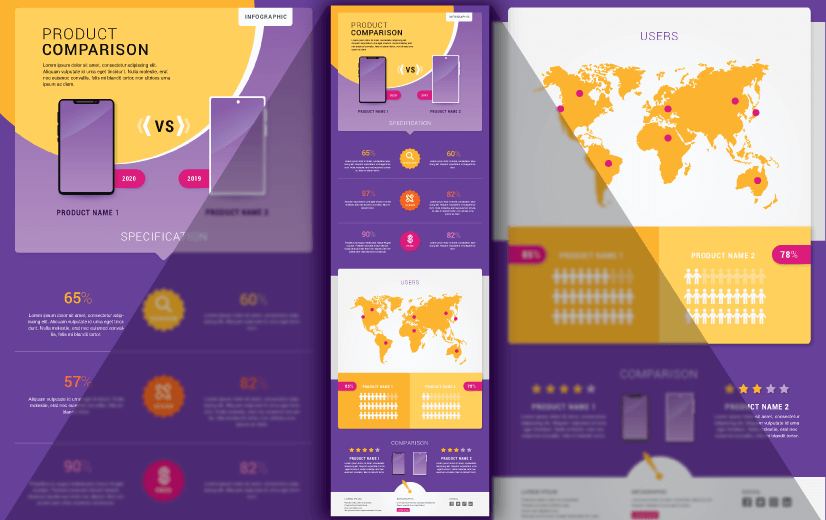
There are five key sections in this infographic.
- A title section
- A section for comparing products or services
- A map, which is the data visualization section
- A usage percentage session
- A final ratings section
This infographic template makes use of a stunning color palette that comprises yellow, orange, purple, and white, with a smattering of bright pink. You can always go the extra mile and modify colors with those that are in line with your brand language.
2. SaaS pricing template by Visme
This absolutely simple and straightforward infographic template will entice new clients to try out your SaaS plans. Using this modern infographic, you can outline the details your clients can enjoy with each SaaS subscription level.
It lets you organize your company’s SaaS plans and features into simple columns and rows, making it easier to distribute information. You can choose to use the template as it is to feature three sets of data, or you can change it by adding or removing rows and columns to match your needs.
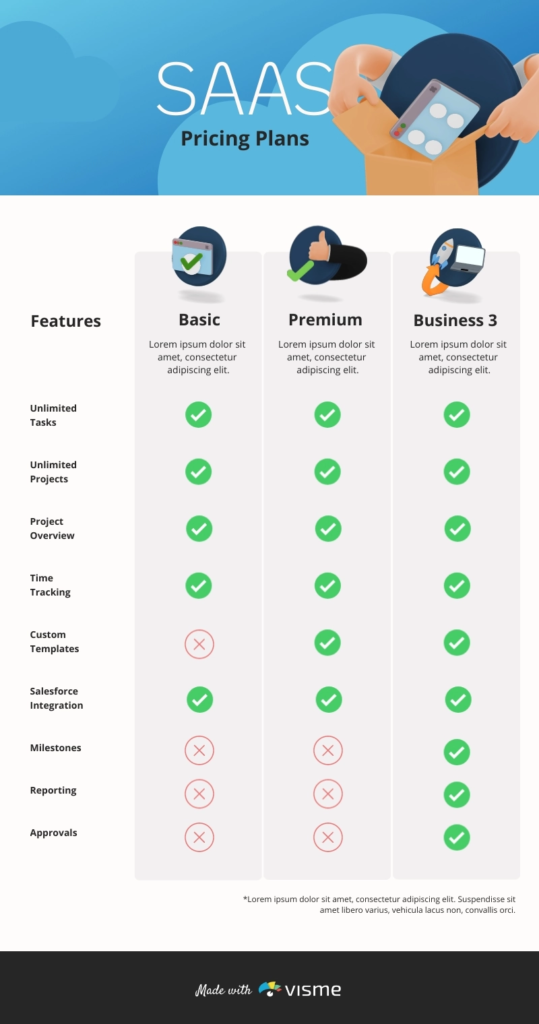
This infographic design template lets you change the color schemes and font styles. You can also customize widgets, maps, charts, and graphs to visualize data more effectively.
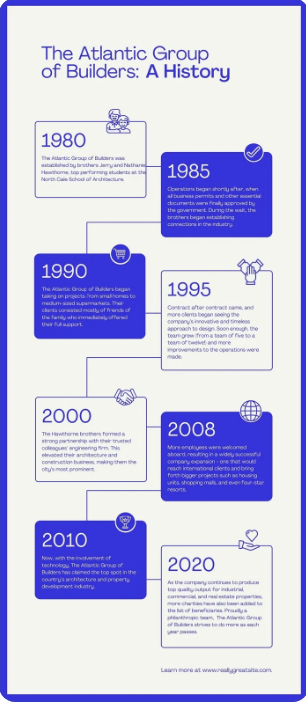
3. Timeline infographic template by Canva
The next infographic design template is a modern design with fresh, vibrant gradients and detailed icon drawings. You can use it to present the history of a concept, a brand, a biography, or anything else that requires a timeline.
Each time period has seven sub-sections in the template. However, because it’s structured as a pattern, you can easily repeat the portions and add new dates by simply modifying the text. Overall, you can create as many time periods as you like on this template.
4. Workflow infographic template by Venngage
A workflow infographic is a visual representation of the flow of one or more processes. It can be made out of the text, graphics, or a combination of the two. It makes several processes simple to understand.
Smart goal-setting should be part of your strategy from the start if you’re launching a campaign to acquire new clients. It requires time and effort, so it’s critical to figure out what kind of marketing strategy would work best for your company. This infographic template will help you develop a process that is easy to follow and engaging. Furthermore, it will be tailored to your particular process.
5. Business plan infographic template by Visme
A business plan typically contains numerous processes that can be hard to explain to potential clients. This is why structuring and summarizing it is of paramount significance. This infographic design template is a good choice for detailing your company plan in a concise, yet effective manner.
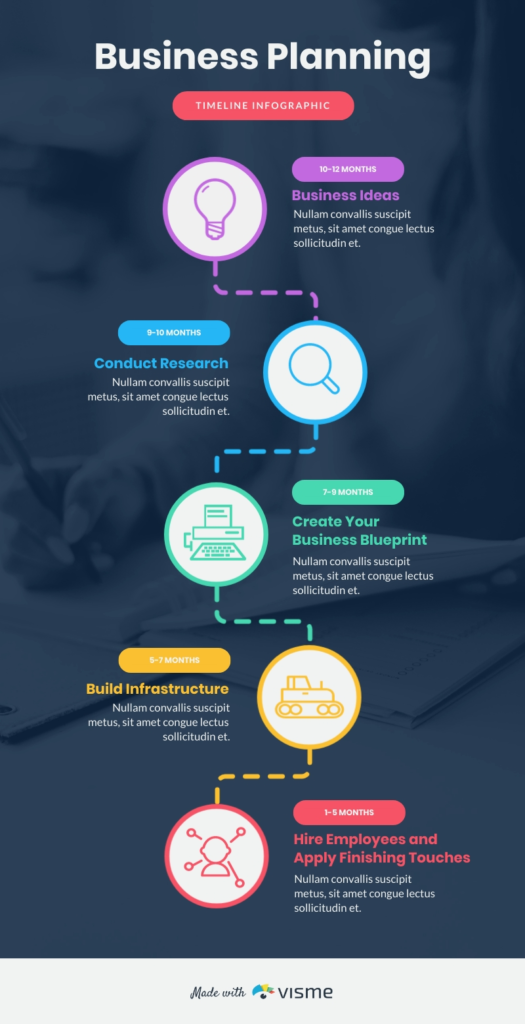
Use your company’s colors, fonts, and logo to personalize the template. Create an infographic that will wow your bosses by adding additional blocks and experimenting with different graphic components.
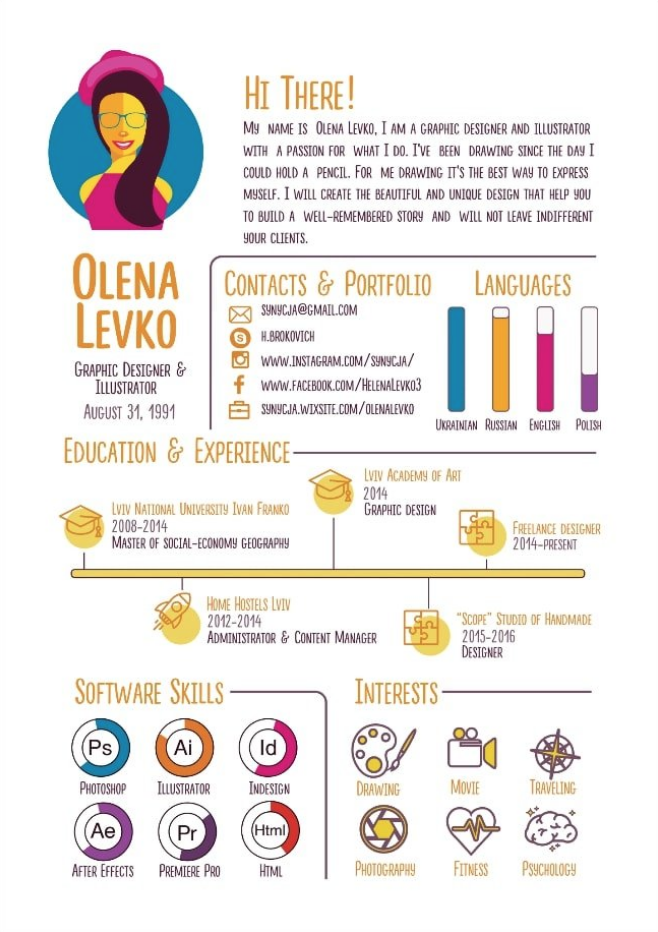
6. Resume design template on Behance
This free infographic template has a specific purpose: to make a strong first impression with a visually appealing CV. The bespoke icons are both useful and entertaining, and the chronology perfectly reflects both the candidate’s schooling and professional experience.
This template by Behance isn’t your typical stock CV template, and it’s ideal for any field you might apply to.
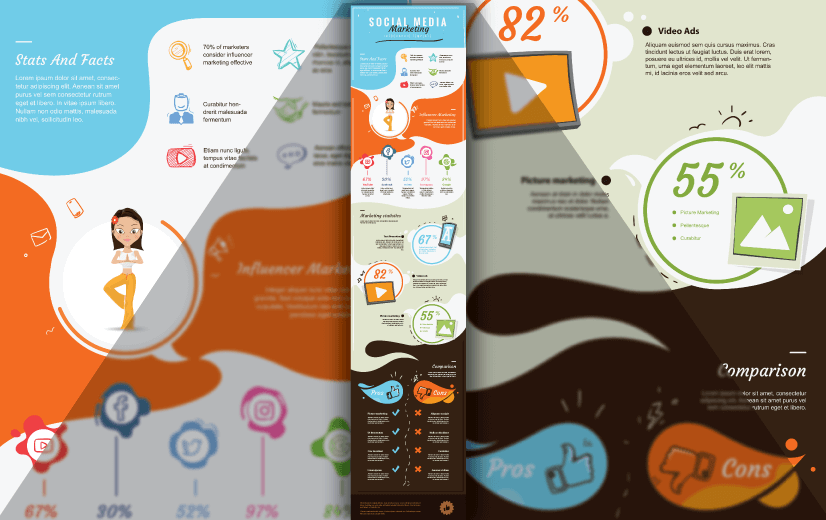
7. Social media marketing template by GraphicMama
In today’s world, creating a strong strategy for social media is crucial. This is when a social media strategy infographic template can come in handy. The below-mentioned template has attention-grabbing graphics, a striking color combination, and a structure that is quite easy to follow and understand.
If you have a clever concept for fellow marketers or your followers, go ahead and use this infographic design template. The components include a review of numbers and information with icons, an overview of influencer marketing, a statistics section, and comparative visuals.
8. Checklist infographic design template by Venngage
With this infographic, you can create many types of checklists. Images, shapes, and a vivid color palette are included in the infographic, which you can customize in minutes for a distinctive look.
The template features information broken down into different blocks, which makes it easier to understand. There are many different shapes to choose from, and you can change the colors and resize them to make the perfect infographic that suits the needs of your project.
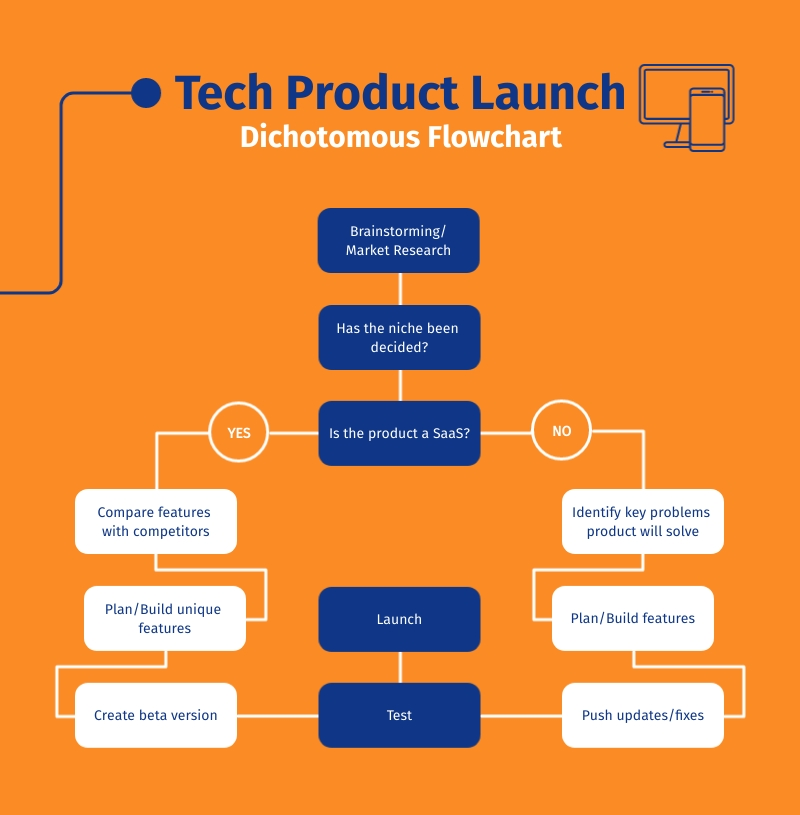
9. Tech product launch template by Visme
An infographic is especially useful in the technology industry, as most wouldn’t be acquainted with the jargon prevalent in the field. An infographic helps simplify that information and makes it more accessible to the masses.
Use this template to design a visually appealing product launch infographic. You can develop tactics depending on what kind of technology you’re launching. If there are any other factors, you can further alter this flowchart.
Many individuals in the tech industry can utilize this template, including companies, consultants, freelancers, and people who want to explain to their audience the various processes associated with tech products.
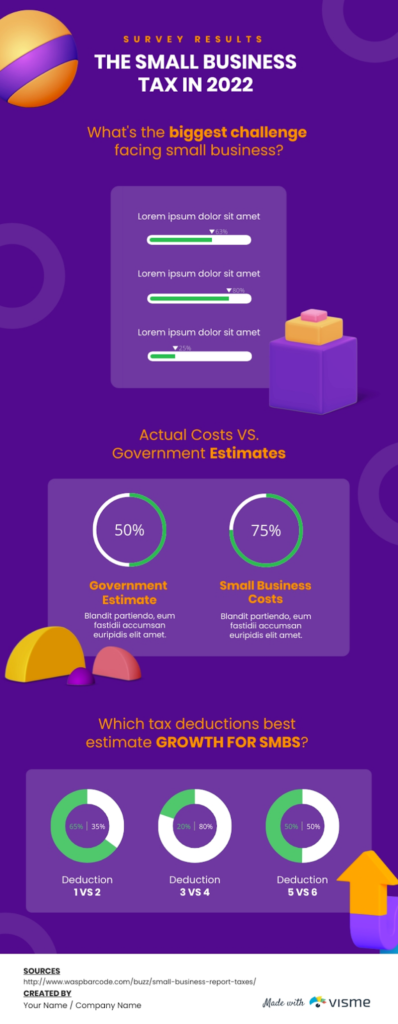
10. Survey results infographic template by Visme
Use this infographic design template to illustrate your survey results and get the most out of your data. The survey results in the infographic template allow you to take all of the raw data, arrange it, and transform it into a beautiful infographic. By adding a new block, you may customize the colors and fonts, tweak the color theme, and even combine this infographic with others.
Key Takeaways
- Infographics are visual representations of information, facts, or data that are used to rapidly and clearly explain complicated information.
- Graphics are known to increase cognition and help users understand complex information easily.
- Making successful infographics entails gathering relevant data, writing captivating text, and presenting it in a timely and visually appealing manner.
- Infographics make it easier to cover heavy topics in a light way.
- Infographics are of many types, but every infographic must have titles, subtitles, relevant data, a coherent story targeted to a specific buyer persona, and visual elements.
- When it comes to designing infographics, you should find credible sources, understand the needs of your audience, keep it engaging, and make sure there is consistency in design.
- Pre-designed templates are a great way to create engaging infographics.
Conclusion
Marketers can use infographics to share interesting information with their audience in a simple and easy-to-understand manner. Depending on your business requirements, decide whether an infographic is a better way to express your message.
When it comes to making infographics, it will most likely take you a few tries before you get the hang of it. You’ll have to understand and decode what works and what doesn’t in your design. Fortunately, infographic designs and guides make this learning process a lot easier. And there are a plethora of infographic design templates from which you might draw inspiration.
If you’re not sure, have someone else comment on your design; they’ll be able to tell you if there’s any information that’s unclear or if there’s any way to improve it. Now that your imagination has been piqued, it’s time to start working on your infographics.
FAQs
Infographics are visual representations of information, facts, or data that are used to rapidly and clearly explain complicated information. They are primarily used to convey a story. Infographics aid in organizing complex data in a way that it becomes easy and interesting for readers.
Data, information, and expertise are visualized effectively in infographics. To provide a coherent overview of a topic, infographics combine images, charts, and text. They have several advantages, including being visually appealing, easy to remember, simplifying a complex topic, and grabbing the user’s attention.
Accurate data is the most critical aspect of an infographic. Before you design an infographic, collate and understand all the data points you want to present to your audience. And build them into a coherent narrative.
Infographics are of many types, but every infographic must-have titles, subtitles, relevant data, a coherent story targeted to a specific persona, and visual elements.
Infographic design templates pre-designed templates you can use to create your own infographics. It is a visual representation of a topic that includes imagery, data visualizations like pie charts and bar graphs, and minimal text.
There are many sources where you can find some of the best infographic templates, such as Canva, Visme, Venngage, and more.
Here are some steps for using an infographic template.
1. Outline the objectives for your infographic.
2. Gather information for your infographic.
3. Create data visualizations.
4. Use an infographic design template to create your design.
5. Make your infographic stand out by adding your brand identity.
Latest Blogs
Explore how Google’s 2025 AI search updates triggered ranking chaos. Learn actionable strategies to adapt your SEO for AI Overviews, zero-click searches, and SERP volatility. Stay ahead now.
Learn how to rank on AI search engines like ChatGPT, Perplexity, and Gemini by optimizing your content for authority, structure, and relevance. Stay ahead in AI-driven search with this strategic guide.
Explore the best healthcare SEO services for your medical practice. Improve online visibility and effectively reach more patients in need of your services.
Get your hands on the latest news!

Similar Posts

Design
7 mins read
15 Best Firms Offering Design Services in India

Design
5 mins read
All You Need to Know About Data-Driven Design

Design
6 mins read