20+ Stats About Infographics Every Marketer Should Know

Table of Contents
- Introduction
- 20+ stats about infographics every marketer should know
- Key Takeaways
- Conclusion
- FAQs
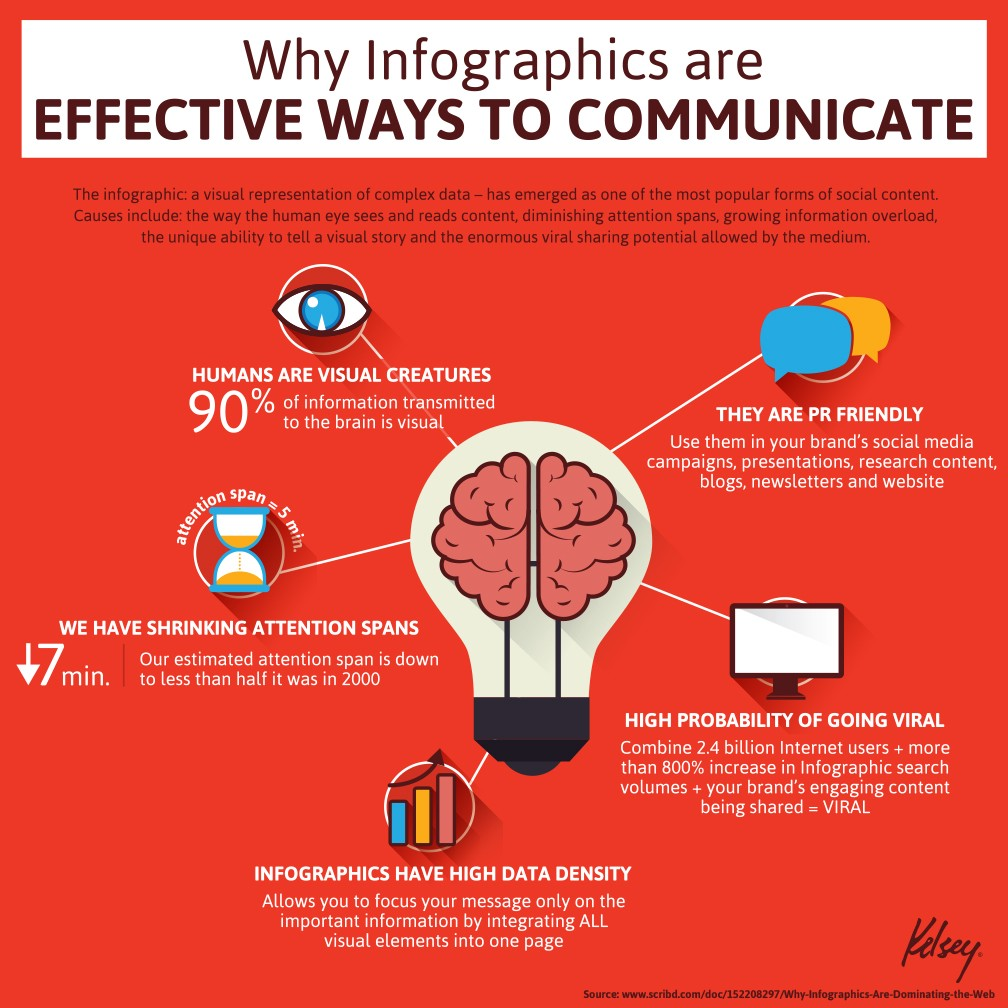
Infographics are powerful pieces of visual content that are engaging, stay in people’s memories, and can be understood easily. Stats demonstrate how easy it is to make your content recognizable and ensure it has better chances to be seen, appreciated, and shared with peers. Even so, marketers must stay on top of the latest research to use it in their content based on infographics statistics for the best results.
20+ Infographic Statistics Every Marketer Should Know
1. Info in people’s memory
The primary benefit of infographics statistics is that, apparently, visuals induce people to remember your content. Utilizing brilliant colors and stunning images captivates the viewers, and research studies indicate an 82% increase in readers’ attention span, according to Visme. Although only 10% of any text remains in the memory for three days, 65% of the information in infographics statistics is recalled even after three days, says Researchgate.
2. Boost productivity
Readers expect value from the content they consume. When content is presented as infographics, it increases your target audience’s productivity manifold. Infographics statistics indicate that a group of people exposed to visuals were 15% more productive than the other group exposed to text.
3. Enhancing communication
According to research, using colors in the visuals can facilitate 70% better reading comprehension (Researchgate). Using colors in your statistical infographics examples ensures your message is understood quickly and with enhanced clarity.
4. Optimum brain processing
Research reports from the Rochester Review indicate that only 50% of the human brain needs to be engaged to process visual information. That’s how appealing infographics stats are to the visually oriented parts of the human brain. Some of the best statistical infographics examples showed infographics could enhance reading comprehension by 50%.
5. Engaging target audiences better
Infographics statistics indicate that visuals are your best marketing asset to enhance audience engagement. A recent survey indicated that 40% of the content marketers realized that they got maximum attention from attractive visuals. A study by Xerox proved 80% better readership rates accrued because of visuals, color, graphs, and images.

6. Infographics help save time
Compared to elaborate text, a stunning design helps save your target audience’s time. Infographics convey an important message quickly, and readers are happy they get the information faster with less time spent. Health statistics are one of the best statistical infographics examples as patients are 2.84 times more likely to understand the risks involved and take appropriate steps, according to Researcgate.

7. Doctors’ handy tool
Infographics statistics have proved that images are doctors’ handy tools. Even health researchers use statistical infographics examples containing visuals to ensure their patients understand information that helps save precious lives.
8. Preventing errors through infographics
When predominant colors are used in infographics, it enables you to organize your content effectively to prevent errors. Researches on color in visuals indicate an 80% decline in errors when visuals were used to explain specific tasks.
9. CTAs work Better
Your content is meant to inspire call-to-action, and one of the best ways to do that is by using visuals to influence users to click on your CTA. Infographics statistics from a study by Aberdeen Group indicate that marketers using data visualizations have 28% better chances of finding the information they seek.
10. Offering enhanced customer service
Companies can offer better customer service and use visuals to educate their customers and offer better training. As per recent studies, using colors in visuals increases motivation levels by 80%.
11. Sharing crucial information
When you have crucial information to share with your target audience, the easiest way to effectively communicate with them is through statistical infographics examples as they get registered instantly. People tend to follow instructions 323% better if images are added to texts.
12. Keep ahead of the competition
In today’s highly competitive world, it is crucial for marketers always to be one step ahead of the competition. Using infographics statistics to scale your design helps you stay far ahead of your competitors, and that’s probably why 49% of content creators consider visual content crucial in their marketing strategy, according to SocialMediaToday.
13. B2B marketers’ best marketing aid
Visual content has proved to be an important strategic tool for most marketers. According to content marketing infographics statistics, over 67% of B2B marketers swear by infographics as their revenues have increased, thanks to using infographics for statistics.
14. Gauging buyer behaviour
According to reports from Infographic World, over 90% of the information reaching the brain is as visuals. People remember 65% of the information they see as images but remember only 10% of what they hear, as per reports from Cognition. Similarly, according to Jeff Bullas, web articles with images receive 94% more views than those without.
15. Enhanced sales engagement
According to imaging pioneers Xerox, visuals and color increase sales by up to 80%. According to infographics statistics from the NN Group, 50% of the consumers are more focused on messages with images. Content Factory reports that the brain can process visual information 60 times faster than plain text. MIS Research provides statistical infographics examples indicating presentations with visuals are 43% more convincing.
16. Learning
Visuals are responsible for 78% more information retention than text. Infographics statistics indicate that only 50% of the brain needs to be used to process visual information.
17. Visuals for Business
Recent trends indicate that visuals will continue to be significant through 2021- 2022 in marketing strategy. Recent statistical infographics examples indicate that over 62% of content creators use visuals twice a week. Over 10% of the budget of 65% of the businesses is set aside for visuals.
18. Creates a lasting impression
Using colorful visuals in infographics can leave a lasting impression in the minds of your target audience. Psychologists report that over 55% of the readers never fail to read messages that come with colorful visuals rather than black and white text.
19. Serves as a reminder
Your target audience better remembers some crucial information when presented as infographics. Adding visual aids enhances memory, and one of the best statistical infographics examples reports people are 30% more likely to remember to make payments promptly when colorful visuals are used.
20. Highlighting key information
The best way to highlight key information contained in the lengthy message is to add colorful visuals to highlight such information. People realize the urgency; close to 39% of them spend less time on such an exercise.
Key Takeaways
Apparently, you can convey your message better with visuals, as is evident from several statistical infographics examples that positively affect users. Using colorful visuals leaves a memorable impression in the target audience’s minds.

Conclusion
The above-cited infographics statistics prove that visuals sway more people than text does. Marketers can take the cue from statistical infographics examples and form their marketing strategy with more visuals included in their content.
FAQs
Statista is probably one of the best sources for infographics statistics. Besides infographics, the website provides statistics for various industries globally. The best collection of statistical infographics examples can be found on this website as charts, graphs, and infographics.
According to a report released by Social Media Today, over 86% of businesses believe that infographics images will remain a significant part of their marketing strategy through 2022 and 2023. Infographics statistics are essential for marketers in today’s fast-paced and competitive atmosphere.
People generally tend to skip elaborate texts even if they contain valuable information. However, if the same info is presented as statistics about infographics, people are 30 times more likely to read them.
Reports indicate that businesses that have used infographics last year have found them effective. The reports further indicate that 74% of the marketers prefer to have images in their social media posts, and 84% believe that statistical infographics examples are effective marketing aids.
Latest Blogs
Explore how Google’s 2025 AI search updates triggered ranking chaos. Learn actionable strategies to adapt your SEO for AI Overviews, zero-click searches, and SERP volatility. Stay ahead now.
Learn how to rank on AI search engines like ChatGPT, Perplexity, and Gemini by optimizing your content for authority, structure, and relevance. Stay ahead in AI-driven search with this strategic guide.
Explore the best healthcare SEO services for your medical practice. Improve online visibility and effectively reach more patients in need of your services.
Get your hands on the latest news!

Similar Posts

Content Marketing
4 mins read
11 Best B2B Content Marketing Agencies for B2B Companies in 2024
Content Marketing
5 mins read
Top ecommerce Marketing Agencies with Proven Strategies for 2024

Content Marketing
5 mins read