
Table of Contents
- Introduction
- What is an infographic?
- Seven ways to use infographics for lead generation
- Key takeaways
- Conclusion
- FAQs
The biggest advantage of the use of infographics is that they attract people to your site. You can use them to get more traffic and increase your chances of making a sale. In this blog, we will talk about how to generate leads through infographics.
We all know that content is king. But if you want to generate leads, you need to create content that is relevant to your target audience. This means that you have to know what type of content is most likely to be popular with your readers.
Infographics have been gaining popularity in recent times. They are a pictorial representation of data, statistics, and facts and are most commonly used for generating awareness about a particular product or project.
Infographics offer users an easy way to learn about something while keeping them engaged to consume more information. A good infographic can also help you reach a wider audience and draw their attention to your work.
Infographics may gain traction on various social media platforms. They’re useful for streamlining procedures, drawing more viewers, generating leads, and bringing more traffic to your website via using infographics as an advertising tool.
What is an Infographic?
An infographic is a visual representation of information and data. By combining elements of text image, chart, diagram, and, more recently, video, an infographic is an effective tool to present data and explain complex issues in a way that can quickly lead to insight and better understanding.

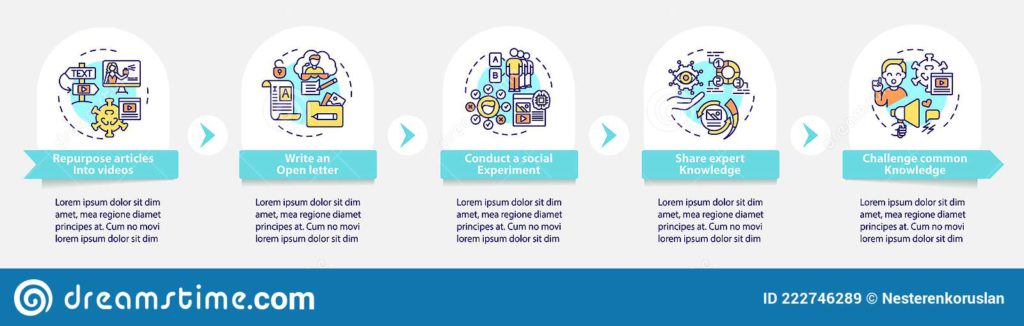
7 Ways to Use Infographics To Generate Leads
Here are some lead generation tips by using infographics:
1. Use infographics to describe your objective
An infographic is essentially a visual representation or display of data. Infographics can be created in various ways, from simple bar charts that compare multiple variables to complex 3-D diagrams that depict complex relationships.
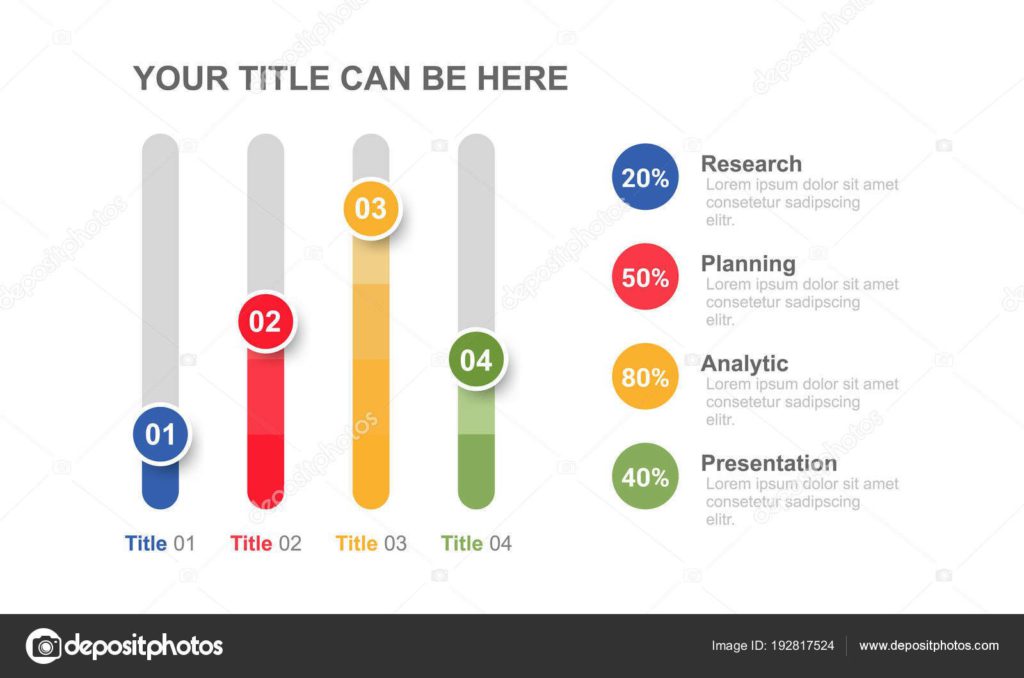
In the first case, you could use the five free infographic templates in PowerPoint to create simple bar charts comparing two or more sets of variable values. You would need to adjust the main title and general layout to suit your needs and add a little bit of color and flair.
In the second case, you may opt for a more detailed infographic with multiple levels of relationships that might include data flows between categories, maps indicating how values were distributed geographically, and so on.
You might also want to include some text boxes that provide more detailed descriptions of each category or variable. For example, if one category value were related to another, you would be able to show this relationship as part of your infographic design process.
Often, a well-designed infographic is the best tool you have to describe your objective. For example, if you want to sell a new product, you might make an infographic that explains how it solves a problem that many people have.
Another objective for an infographic is to lead people to something else. For example, you can provide a downloadable spreadsheet with all the data from your infographic so that people can customize it and use it for their own purposes. Or you can provide additional information about the issue after they finish filling out the form.
2. Add your infographics to your blog posts to derive your target audience
Infographics are a great way to communicate information to your target audience because of their visual nature. It is also highly shareable on social media, and you can use it for your SEO efforts by embedding keywords and links to your site.
Infographics are also useful for generating leads and driving your target audience to your website or product. I mean, think about it. You are sharing valuable information in an engaging way, yet you can still subtly promote your brand, products, or services through the infographic. In other words, it’s the perfect lead generation tool!
3. By optimizing your infographic and social media posts
The most important thing to remember about creating an infographic is that you need to think through how you will optimize it. If it’s not optimized, you will lose followers and potential visitors.
Keep in mind the reason why people share infographics; to be able to find them organically. Considering this, you can optimize your content with keywords and images already popular on social media platforms.
You might want to add a title or summary to your infographic, but don’t make it so long that people can’t find the information you want them to find. The best way to do this is with a strong tagline. The tagline should be short and descriptive and tell the reader what your infographic is about in one or two lines.
For example: ‘How to boost your sales with X’
This short tagline will help people scan the chart for the most important points. It will also make it easier for people who share your infographic to embed it in their own site’s content on social media platforms, which allows it to be more widely seen by new readers.
4. Adding a CTA
You can also display your infographic in a blog post, a comment on another blog post, or your own website. You should choose one of these options because it allows you to get links from other blogs.
Inserting a call to action into an infographic is best to make it useful for traffic generation. By inserting a call to action into the infographic, you can encourage visitors to leave their email addresses and receive your free resources. You can also send them a message after they leave their email address, asking them if they’d be interested in hearing about future updates. This makes users feel connected to your brand.

5. Create an easily shareable infographic
A lot of people still don’t use social media for sharing. But if you want to get your work in front of a wider audience, these tools are ideal because they make the work more visible and easier to share.
Facebook, Twitter, and Google all have easy ways of getting your stuff in front of many people. Therefore, add buttons below your infographics to lure people into sharing your content easily.
6. Get familiar with designing tools
If you can create your own infographic images, that’s excellent; if not, there are various free options accessible. One of them is part of a bundle called the five free graphic designs in PowerPoint format. In this situation, all you have to do is input the data that you planned out in the previous step, change the images to reflect the data, and you’ve got your personalized infographic.
There are a variety of free websites that provide access to a wide variety of visual content, including infographics. Canva and Venngage are two examples of free platforms that let you update for a fair fee.
7. Leverage your infographics for lead generation
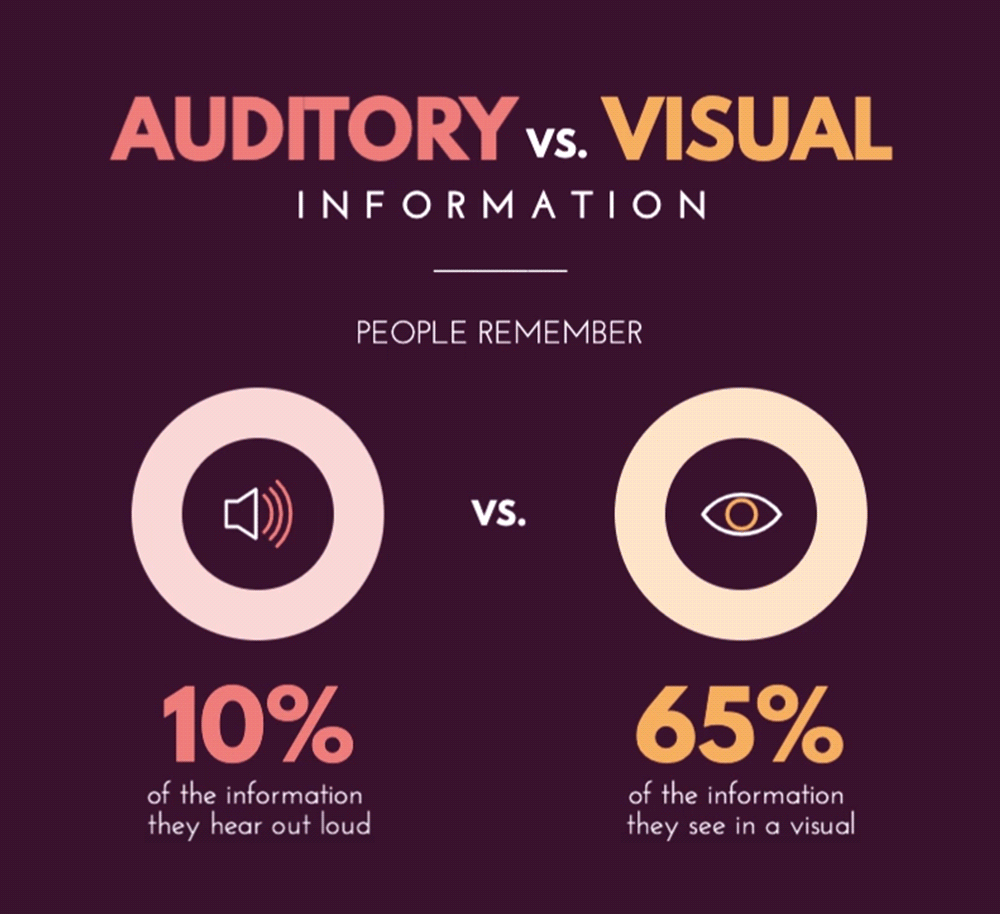
A picture can speak more than a thousand words in the modern world. There is no doubt that what we perceive through our eyes is much more important than what we hear through our ears.
However, it’s not just the visual nature of infographics that makes them so effective. It’s their design.
Infographics are designed to express your message so that people can understand and remember, and the better the design, the more likely your audience will be to understand and remember it.
There is a tendency to view infographics as a purely digital, technology-driven media form. But in practice, they are more hybrid. Infographics combine the best of the written word and graphic design to capture the audience’s attention and, in some cases, launch a sale.
Infographics are often seen as ‘on-demand’ content since they can be created quickly to support social media campaigns, create awareness around products or services, and use it for lead generation without investing in long-term editorial content creation. However, this is not true – infographics don’t require anyone’s time. Time is just one of the many costs associated with creating them.
The opportunity with this content lies in its ability to support lead generation because it can be created quickly, shared across multiple platforms, and tend to rank well on search engines.
Key Takeaways
- Infographics are a powerful tool, but most people have no idea how powerful.
- The way infographics work is simple: People love them. They are fun and entertaining. They look great in social media posts and websites, and they are often highly shareable.
- They can be used to generate leads.
- Infographics can be used to describe or tell your story.
- They can be easily designed.
- You can use them everywhere and especially in your blogs to generate traffic.
- You need to create an easily shareable infographic.
- But for all of that to happen, you need to understand and work with design tools such as Canva, Adobe Photoshop, etc.
Conclusion
Infographics have become extremely popular over the years. They are a great way to visually present data in an easy-to-understand and remember manner. People tend to skim over content in today’s world instead of reading the full article. This is why it is so important for content creators to make their material as engaging and interesting as possible.
Infographics are visual representations of data or information that allow us to quickly and easily grasp complex concepts and ideas. They take advantage of our brain’s natural tendency to pay more attention to visual cues than text. A well-designed infographic with reliable data makes it easy for viewers to follow along and easily transform complex information into visually appealing content.
Infographics can gain popularity on many social media platforms and make great tools for simplifying processes, attracting more viewers, untimely generating leads, and driving more traffic to your website through infographic promotion services.
Infographics serve the purpose of helping people better understand a topic. They are a proven way to increase reader engagement and lead generation because they convey information to viewers in an easy-to-follow way.
Infographic promotion is often needed to help infographics gain popularity on social media platforms like Facebook, Twitter, and LinkedIn. Infographic promotion services can help drive traffic to your website through social sharing and social media outreach services.
So, If you’re looking for something easy to help you boost your lead generation game, infographics are great!
FAQs
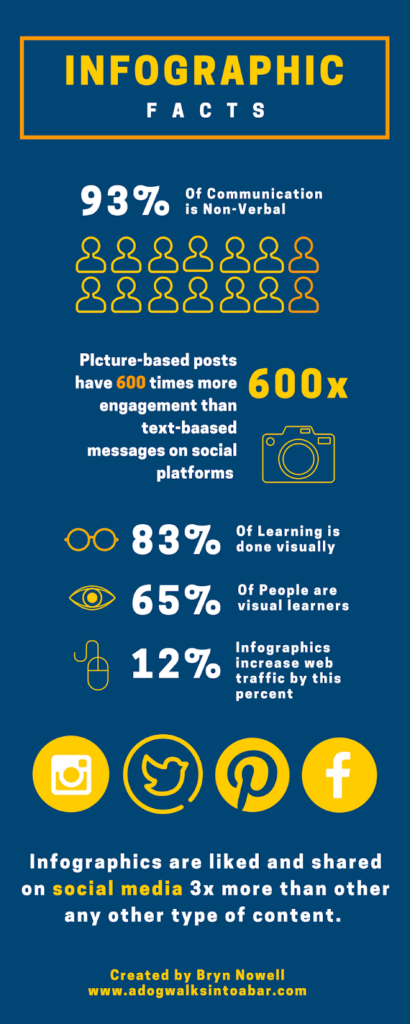
Infographics are a fantastic way to promote your content offers and generate more leads because they are shared three times more than other types of content. They also increase people’s desire to read the content by 80%. That is why creating infographics is an incredibly effective lead generation strategy.
We can improve lead generation by using these tactics:
1. Add relevant SEO in keywords
2. Stay relevant and consistent
3. Keep it short and simple
4. Add a relevant CTA
5. Keep your infographics presentable
Here are a few benefits of using infographics:
Infographics are eye-catching and persuasive
They are easily readable
Great for SEO rankings
Generate more visitors to your website
Infographics are a valuable content marketing asset because they help brands build awareness and recognition. Infographics are easily digestible visual representations of information, data, or knowledge and, when done well, can be used over and over again to build brand awareness without having to start from scratch continuously.
They attract audiences by making complex information engaging and easy to understand. Plus, they are highly shareable.
Infographics improve brand awareness by:
Creating a buzz around your brand through social media sharing
Leveraging your audience’s network of connections
Increasing the number of backlinks to your site through syndication
Promoting your brand as a thought leader in your industry
Allowing you to connect with new audiences on different platforms
Infographics put information at the fingertips of readers who have come to expect convenience and speed from their interactions. In today’s busy world, few people have the time or inclination to read through paragraph after paragraph of text to find what they’re looking for. Infographics present data in an easy-to-digest format that can be consumed quickly without sacrificing quality.
Latest Blogs
Explore how Google’s 2025 AI search updates triggered ranking chaos. Learn actionable strategies to adapt your SEO for AI Overviews, zero-click searches, and SERP volatility. Stay ahead now.
Learn how to rank on AI search engines like ChatGPT, Perplexity, and Gemini by optimizing your content for authority, structure, and relevance. Stay ahead in AI-driven search with this strategic guide.
Explore the best healthcare SEO services for your medical practice. Improve online visibility and effectively reach more patients in need of your services.
Get your hands on the latest news!

Similar Posts

Design
7 mins read
15 Best Firms Offering Design Services in India

Design
5 mins read
All You Need to Know About Data-Driven Design

Design
6 mins read