How to Create Infographics: A Step-by-Step Guide [+5 Tools]
![How to Create Infographics: A Step-by-Step Guide [+5 Tools]](/_next/image/?url=https%3A%2F%2Fwordpress.peppercontent.io%2Fwp-content%2Fuploads%2F2022%2F02%2F5-resources-to-create-eye-catching-infographics.png&w=1536&q=75)
Table of Contents
- How to Make a Good Infographic in 5 Basic Steps
- 5 Resources to Create Eye-Catching Infographics
- Key Takeaways
- Conclusion
- FAQs
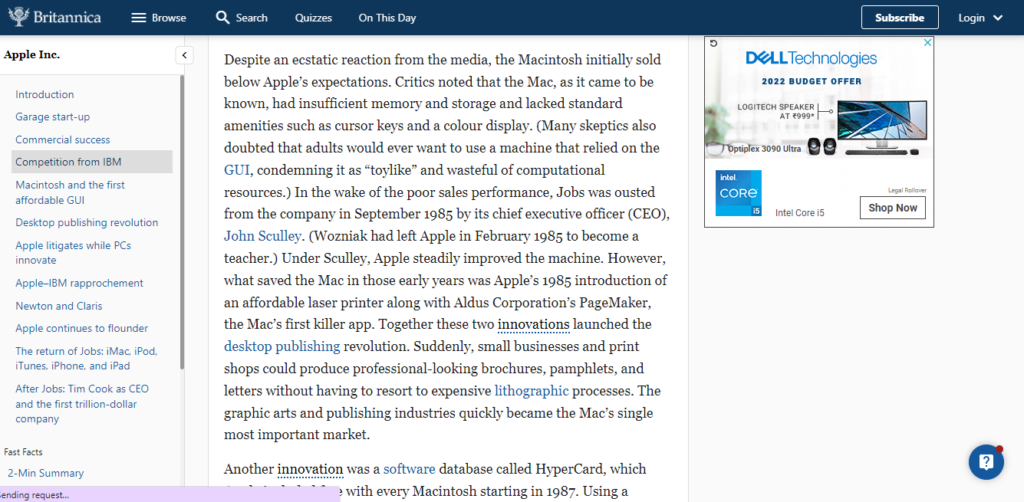
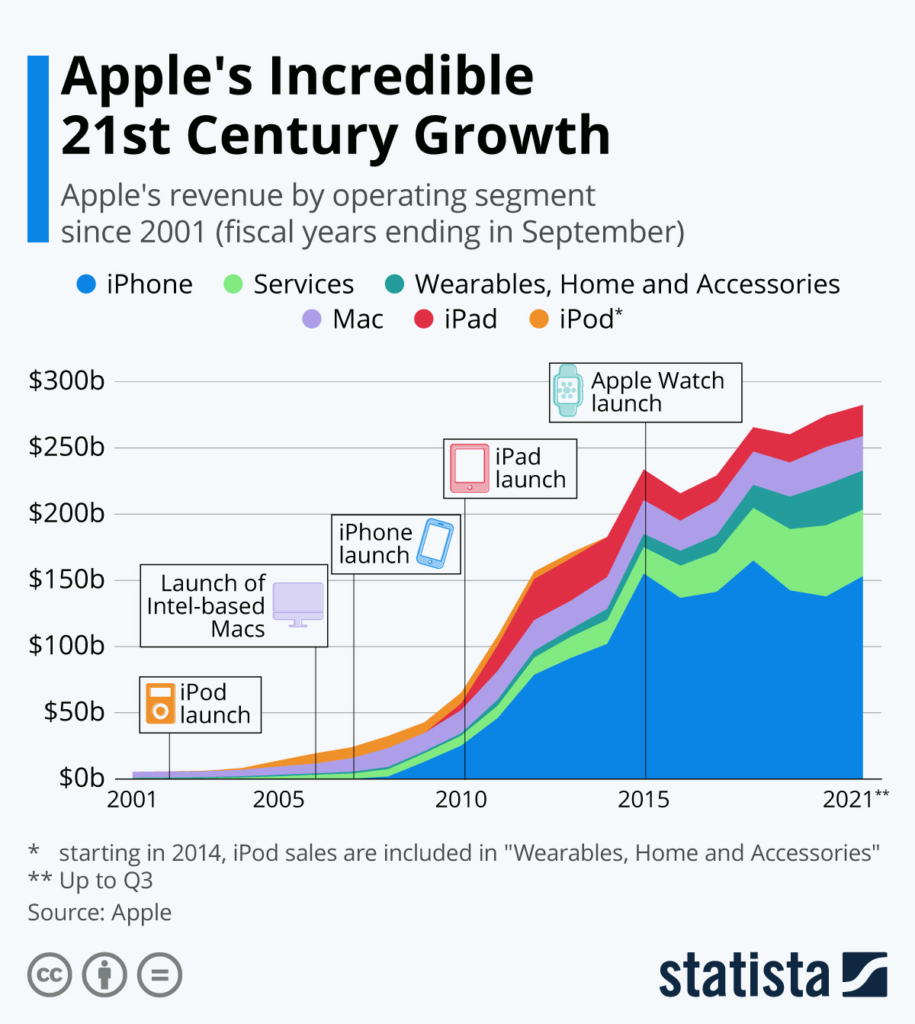
Take a look at the above two images. Which one appears to be more appealing to you?
Obviously, the first one. Isn’t it? While both discuss the same subject—the evolution of tech giant Apple—it is the way in which the information is conveyed that makes all the difference.
That’s the advantage of infographics: they make your text more attractive to the readers. If you compare both the images, the visuals in the second one make the information more compelling and easy to digest. And marketers agree that learning how to create infographics has become the need of the hour.
Infographics are nothing but the representation of long texts, data, and information in the form of visually attractive graphical designs, charts, and images. They are used to enhance the quality of the content (because let’s be honest: who likes reading long, boring text?)
According to research, 90% of the information transmitted to the brain is visual. Further, our brains process visuals 60,000 times faster than text. Hence, visuals have a greater impact on our memory as well.
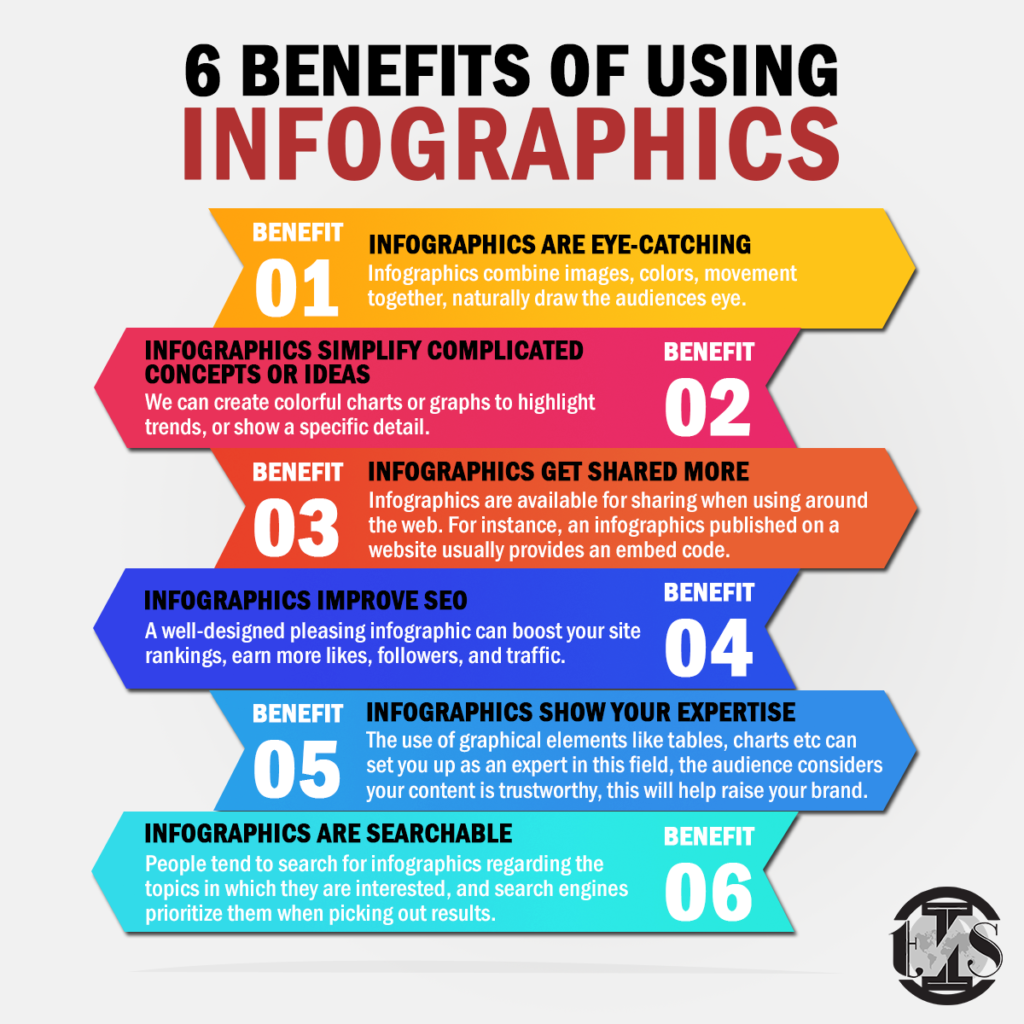
Infographics are also the best way to boost your marketing game. They can simplify complex information and present it in an easy-to-understand manner. Further, infographics can also skyrocket your SEO, because visuals tend to attract 94% more views than text-heavy content.
You need to understand how to make a good infographic that will appeal to your audience. Creating infographics requires you to maintain the balance between presenting relevant information in an engaging way and overstuffing your content with imagery. Before we look into some infographic creation tools, let’s understand how to create an infographic.
How to Make a Good Infographic in 5 Basic Steps
By following these steps, you will know how to make an infographic design that will stand out in front of your audience.
Step 1: know your target audience
You need to know who your ideal audience is, i.e., who would be willing to read your content and look at your infographics. Knowing your target audience makes it easier for you to understand the type of content they are looking for. Also, you will know which type of information, charts, and data work best for them, and help them to connect with you.
Step 2: define your goals
Have a clear goal on what you want to share through your infographics. Whether it’s some information, comparisons, graphs or something else, have a clear vision in mind. This will help you convey the right information without overstuffing your infographic with too much of it.
Step 3: collect all the necessary information
After you have defined your goal, gather all the information you need to present to your audience. Remember, you can’t include everything in the infographic. You have to narrow down your information to relevant points and statistics to avoid overcrowding and make it visually appealing to your audience.
Step 4: choose an infographic creation tool
The next step is to carefully pick a tool that will help you create an infographic. You can also select an infographic template and customize it as per your requirements. We will talk about some of the best infographic creation tools ahead.
Step 5: download and share
Once you customize your infographic, you can download it and share it with your audience. Remember, choosing the right colors for your infographic is as important as choosing the right words. Your infographic won’t make the necessary impact if it is poorly crafted.
5 Resources to Create Eye-Catching Infographics
Creating an eye-catching infographic is not rocket science. You can easily learn how to create a good infographic by yourself or hire somebody to create one for you. We have listed a collection of the five best infographic creation tools to help you learn how to create an infographic that grabs eyeballs. Let’s have a look at them.
1. Canva
Canva is an excellent tool for all your design needs. From logos and social media posts to infographics, you can create everything related to design on this platform. Canva has a wide range of templates and illustrations, so you can easily go with one that suits your needs the most, and customize it according to your wish. You can make the perfect infographic on Canva by following a few simple steps.
- You need to open Canva and search for the term “infographics”.
- Select a suitable template from the pool of templates available.
- You can even use the search tool to narrow down your search results.
- Then customize your infographics with your choice of colors, fonts, and themes.
- You must also add relevant information, charts, and other visual elements.
- After completing the design, download and save your infographic as a JPEG, PNG, or GIF file.
- Use it on your website or share it on your social media handles.
Cost
Canva is free to use, but it has limited features in the free version. With Canva Pro, you get some premium features and more fonts and designs at $12.99 per month for up to five users.
Advantages
- It is very user-friendly and easy to use.
- No prior designing skills are required.
- Multiple ready-to-use templates and fonts
- Easily customizable designs
- The premium version is also budget-friendly.
Drawbacks
- Limited templates in the free version
- Overuse of same design by a lot a people
- No local file storage option
- Limited export settings
- Limited font types in the free version
2. Piktochart
Piktochart is an amazing tool to create posters, presentations, flyers, and of course, infographics. Its easy-to-use features and flexible design facilities enable users to create the exact visuals they want.
There are numerous templates available on Piktochart to create infographics. Some are free, and others are limited to the paid version. You can pick a premade template and start customizing it, or you may even start creating an infographic from scratch.
Creating an infographic on this platform is not too different from the process you follow on Canva. After choosing or creating a template, you can change the background, fonts, images, and texts. You can also add additional images for higher personalization. Once you add all the relevant information and data, you can download it in your preferred file format and share it on your website or social media handles.
Cost
Piktochart is also free to use, with great features. However, the Pro version is available for $14 per member, per month. It also offers special rates to companies with more than 25 members.
Advantages
- This infographic creation tool is intuitive and easy to use.
- Wide collection of templates
- Reasonable subscription plans
- High-resolution downloads
- Rich design toolkit
Drawbacks
- Poor dashboard interface
- Limited access to everything in the free version, as compared to other infographic creation tools.
3. Venngage
Similar to the other infographic creation tools mentioned above, Venngage offers various design features to create social media posts, posters, promotions, and infographics.
There is a wide range of templates available for infographics, categorized as statistical, informational, comparisons, charts, process, timelines, and more. You can select any template from a suitable category and start customizing it. You can pick the color, themes, background, and fonts of your choice. Some templates are limited to the premium version, but the free ones are also good to consider.
Venngage also allows you to insert widgets like maps and charts based on the information contained in your infographics. Once you’re done, you can easily download the infographic and share it.
Cost
Venngage provides free access to limited features. With a premium version priced at $16 per month per user, you can unlock additional features. For businesses, they have a package of $39 per month. And enterprises can pay $499 per month, for a team of over ten members.
Advantages
- Unlimited infographics
- Easily customizable templates
- Cost-effective plans
- Dedicated assistance
Drawbacks
- The free version has limited features.
- There are certain limitations when it comes to image uploads.
- Images cannot be downloaded as PDF or PNG files in the free version.
4. easelly
This infographic creation tool assists you in visualizing all kinds of information and lets you create beautiful infographics, posters, and presentations. Once you open the website, you will find a variety of infographic templates. You can also search for one by category, from the template library.
As you select one, you can edit and customize it without even creating an account. However, you will have to create an account when you want to save and share your infographics. Easel.ly also enables you to change the background, fonts, themes, texts, and charts of your infographic.
Cost
Easel.ly comes with a flexible pricing plan for everyone. The tool is priced at $2 for students, $4 for teachers and other individuals, and $5 for businesses.
Advantages
- Easy to use
- Pre-existing templates are useful for infographics
- Huge collection of templates
- Reasonable pricing
- Dedicated customer assistance
Drawbacks
- Customization options may not be extensive enough
- Sometimes certain existing elements in a template cannot be changed.
- The library is less organized, as compared to other infographic creation tools.
5. Freepik
Freepik has a wide pool of free images. It also comes with thousands of infographic vectors to choose from. You can select a template from the library and customize it. Add relevant data and your favorite background, color, and fonts. Download the infographic and share it, and you’re good to go.
Cost
Freepik has a range of free features you can choose from. The premium version starts at $11.36 per month.
Advantages
- A wide range of infographic templates
- High-quality images
Drawbacks
- It doesn’t allow as many customization facilities as other infographic creation tools.
- You can download the images for free, but for customization, you’ll need a vector graphics editor.
Key Takeaways
- In today’s digitized world, it is crucial to learn how to make a good infographic.
- Avoid using long texts for your infographic.
- Present your content with the help of images, charts, and graphics.
- Know how to make an infographic design that appeals to your audience and grabs their attention.
- 90% of the information transmitted to our brain is visual.
- Our brain processes visuals 60,000 times faster than texts.
- Infographics can also boost your marketing game and SEO.
- You can easily make different types of infographics by using various infographic creation tools, such as the ones mentioned above.

Conclusion
Thousands of people are in the race of creating and posting content, and so you have to be unique and different. Infographics are a way to stand out from the crowd. This is why it’s highly imperative to learn how to create infographics. There are many more infographic creation tools, apart from the ones mentioned above. You can use any of them, depending on your needs and suitability. All of them have their benefits and drawbacks, but most of them are beginner-friendly and easy to use.
Creating content and conveying information to millions of people all over the world is not an easy task. It’s extremely challenging to make content that can grab your reader’s attention and effectively communicate your message to your readers. In this era, where content is the king and every brand and marketer is vying for consumers’ attention, it is crucial to distinguish yourself from your competitors.
FAQs
Infographics are used to present long texts in a visually attractive way, with the help of graphics, charts, and images. Infographics make the content easy to read and digest.
Making an eye-catching infographic isn’t that difficult. You can learn how to make a good infographic by following these steps.
Start with good content.
Observe your competitors.
Create an outline.
Know your audience.
Keep it simple.
Use friendly colors and don’t overstuff elements.
You can use Canva, Piktochart, Venngage, easelly, Freepik, Google Charts, and Visme, among many others.
To make your infographics attention-grabbing, you need to:
Understand the purpose of creating infographics.
Narrow your ideas to a few words and use images to showcase them.
Use appealing fonts and bright colors.
Use a few words and highlight them wherever necessary.
Bold the important information.
You can follow the following five steps to create a wonderful infographic.
Know your target audience.
Define your goals.
Collect all the necessary information.
Use a suitable infographic creation tool.
Download and share.
Some of the most all-time eye-catching color combinations you can use in an infographic are as follows:
Pink and gray
Black and white
Pink and black
Purple and yellow
Baby pink and blue
Royal blue and peach
Red and yell
Latest Blogs
Explore how Google’s 2025 AI search updates triggered ranking chaos. Learn actionable strategies to adapt your SEO for AI Overviews, zero-click searches, and SERP volatility. Stay ahead now.
Learn how to rank on AI search engines like ChatGPT, Perplexity, and Gemini by optimizing your content for authority, structure, and relevance. Stay ahead in AI-driven search with this strategic guide.
Explore the best healthcare SEO services for your medical practice. Improve online visibility and effectively reach more patients in need of your services.
Get your hands on the latest news!

Similar Posts

Design
7 mins read
15 Best Firms Offering Design Services in India

Design
5 mins read
All You Need to Know About Data-Driven Design

Design
6 mins read