Show, Don’t Tell: 6 Practical Data Visualization Tips
Table of Contents
- 6 Design Tips to Visualize Data Effectively
- Key Takeaways
- Conclusion
- FAQs
As a designer, you may be overwhelmed when getting started with data visualization. Visualizing data through infographics, graphs, dashboards, and charts helps translate numbers into practical conversations. With so many areas to cover, data visualization may sometimes leave you numb. And it can be a daunting task especially if you are a beginner. This is why it becomes a must to be aware of the steps involved in the process of data visualization. Referring to some practical tips for designers also helps.
6 Design Tips to Visualize Data Effectively
If you’re feeling lost, you can refer to the following design tips.
1. Begin by knowing your target audience
One of the crucial tips for designers is to know and analyze their audiences well. You cannot simply go ahead and start creating graphics. A bit of planning is needed. This way, you can save hours of rework. Who is going to use your data to make decisions is what you need to focus on. The process involves closely knowing the following factors:
- The numeracy skill of your audience
- Their familiarity levels with data visualization
- Their decision-making patterns
- How much time they can spend consuming your content
2. Opt for the right data chart
The next tip for designers is to select the right type of chart for your data. This is important because the type of data chart you choose will either lead to or deviate from your story. It is one of the key responsive design tips for beginners. Each data chart’s purpose must be clear to you so that you can extract the maximum out of your inputs.
3. Make the most of the labels and text
One of the best tips for graphic designers is to include labels and text in data. They should be implemented in a way that they clarify and not clutter. Considering the following aspects may help you.
- Avoid using a legend unless instructed.
- Label exact values only if they matter.
- Ensure your labels and texts are readable.
- Avoid the natural temptation to clutter the visualization with text.
- Ask for an expert opinion.
4. Deploy colors to highlight vital details
Colors make data visualizations appear even more enticing and engaging. But the data visualization tip here is to avoid the overuse of colors. You should use color to highlight, differentiate, or compare. Below are a few points to consider.
- Use colors to present your point interestingly.
- Color-contrast diverse sets of data.
- Show anomalies or outliners via appropriate colors.
- Your colors’ selection should be intuitive.
- Avoid adding more color just for fun.
- If your data increases or diminishes in intensity, you should only use color gradients.
5. Avoid misleading visualizations
Misleading visualizations may confuse your audience. One of the better tips for data visualization is to have an honest presentation of your data. The most vital considerations to make are as follows:
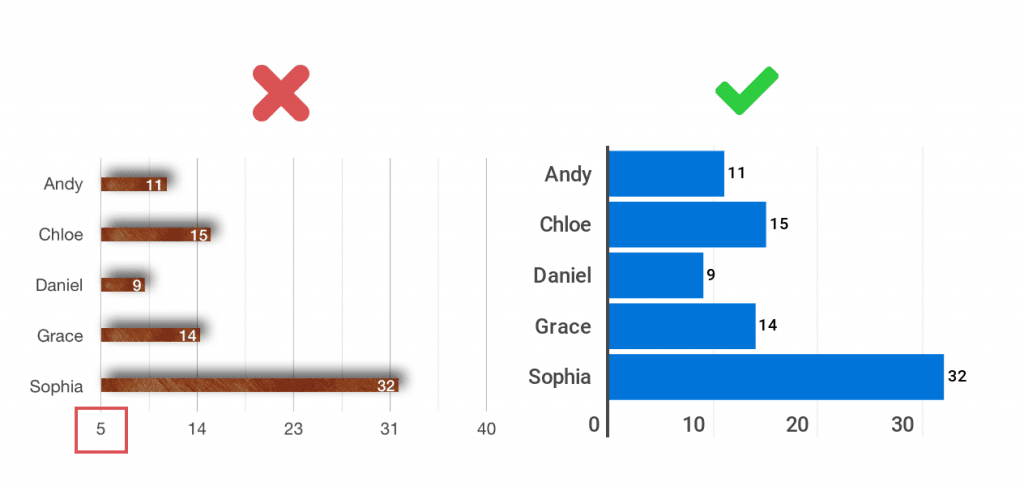
- Start with 0 on the axes.
- Never alter your visualizations’ aspect ratio.
- Don’t hide significant data.
- Avoid putting in too many details.
- Group elements that relate to each other.

6. Keep it simple
Many designers include extra details in their data visualizations. It leads to their outcomes looking flawed. Therefore, the trick here is to keep it as simple as possible. You need to take into account the following elements:
- Remove information that gives no meaning to your audience.
- Know that including 3D in every data visualization piece is not going to help.
- Unbalanced visuals won’t do any good.
- Keeping your visuals basic, simple, short, and sweet is the way ahead.
Key Takeaways
- Data visualization empowers business owners to enjoy insights into huge amounts of data.
- Data visualization helps businesses know about the new trends, patterns, and errors in data. Addressing these issues can help users pay attention to areas with red flags.
- Designers need to come up with data visualization, but they may be overwhelmed with the sheer amount of data. It becomes vital to follow some steps to ensure a winning data visualization process without glitches.
- Once some vital tips for designers are followed, it may become easier to visualize data.
Conclusion
Mentioned above were the vital steps that can help you come up with winning data visualizations. Considering these tips for designers, you can easily craft an interesting data visualization plan for your projects. Data visualization commands an enormous power to showcase important information. It does that by enhancing data-based arguments.
While looking at the data, you are exposed to opinion as well as interpretation. And needless to mention, data visualization is the strongest and most efficient way with which you can get your point across. It does not matter what field or business you are from; the significance of data visualization can’t be avoided.
Data visualization is also one of the pivotal steps in the process of business intelligence. It takes raw data, models it, and delivers it to reach the bottom line. Scientifically speaking, data visualization sends across any type of information in a universally accepted fashion.
There are many benefits of data visualization: from establishing correlations to depicting market trends.
The prevailing data visualization tools are infographics, fever charts, heat maps, histograms, and area charts or graphs. The practice of using data visualization is prevalent in many industries. Its key purpose is to boost sales, increase user engagement, and target new niches.
Data visualization is the need of the hour. It is because the brain of a human is not programmed to consume a large amount of unorganized or raw data. This is why there is a need for graphs and charts to transfer results. They help you easily identify trends and patterns to enjoy quick insights and decide better.

FAQs
Data visualization provides us with a clear idea of information by setting a visual context. It makes data easy to interpret and helps you make better decisions quickly, even with large data sets. Taking into account data visualization tips for designers will surely help you present data effectively.
The three most important rules of data visualization are that it should be simple, standardized, and scalable.
The basic data visualization types include interactive and static ones.
Some of the most important data visualization software examples include Google Charts, FusionCharts, D3.js, and more.
The most basic yet vital perk of data visualization is that it can help you interpret a large amount of data easily. It can also help you make informed decisions.
One of the most famous forms of data visualization is a column chart. Including it in data visualization processes is one of the most suggested tips for designers.
Latest Blogs
Explore how Google’s 2025 AI search updates triggered ranking chaos. Learn actionable strategies to adapt your SEO for AI Overviews, zero-click searches, and SERP volatility. Stay ahead now.
Learn how to rank on AI search engines like ChatGPT, Perplexity, and Gemini by optimizing your content for authority, structure, and relevance. Stay ahead in AI-driven search with this strategic guide.
Explore the best healthcare SEO services for your medical practice. Improve online visibility and effectively reach more patients in need of your services.
Get your hands on the latest news!

Similar Posts

Design
7 mins read
15 Best Firms Offering Design Services in India

Design
5 mins read
All You Need to Know About Data-Driven Design

Design
6 mins read