How To Create a Social Media Report and Explain It to Your Boss or Client?
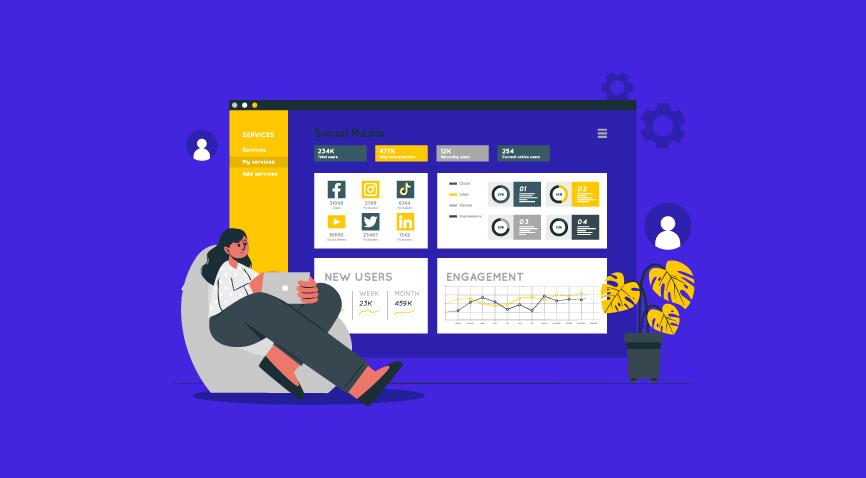
Table of Contents
- How to Create a Social Media Report
- Elements of a Social Media Report
- How to Explain Social Media Data
A social media report is a document that demonstrates the performance of your social networks. It offers a way to extract value from data based on several social media report examples: Facebook, LinkedIn, Twitter, Youtube, etc. It includes all essential social media data like reach, conversions, followers, awareness, and engagements necessary for today’s businesses. Through this, you will be able to figure out your social media performance.
This blog will focus on how to create a social media report and explain it to your boss or client.
How To Create A Social Media Report
In Google Analytics, select All Traffic> Channels. This report will show you the percentage of traffic from social media and traffic from direct, search, referral, and email.
Social media reporting is an invaluable resource for obtaining the benefits of your social networking strategy. Social media marketing reports aid in more intelligent content and creation, result-driven scheduling, proving the value of your strategy, and identifying trends and new opportunities.
Social media report tools benefit from displaying all your data on the same page. They allow for faster comparison of metrics and make way for deeper analysis. Invest in an excellent social media reporting tool that simplifies your reporting tasks and gives you a comprehensive glance at your brand’s social media performance.
Create a unique social media report with the help of the various reporting tools and present it to your boss or client and give them a clear picture of the result of your social media marketing efforts.

Elements of a Social Media Report
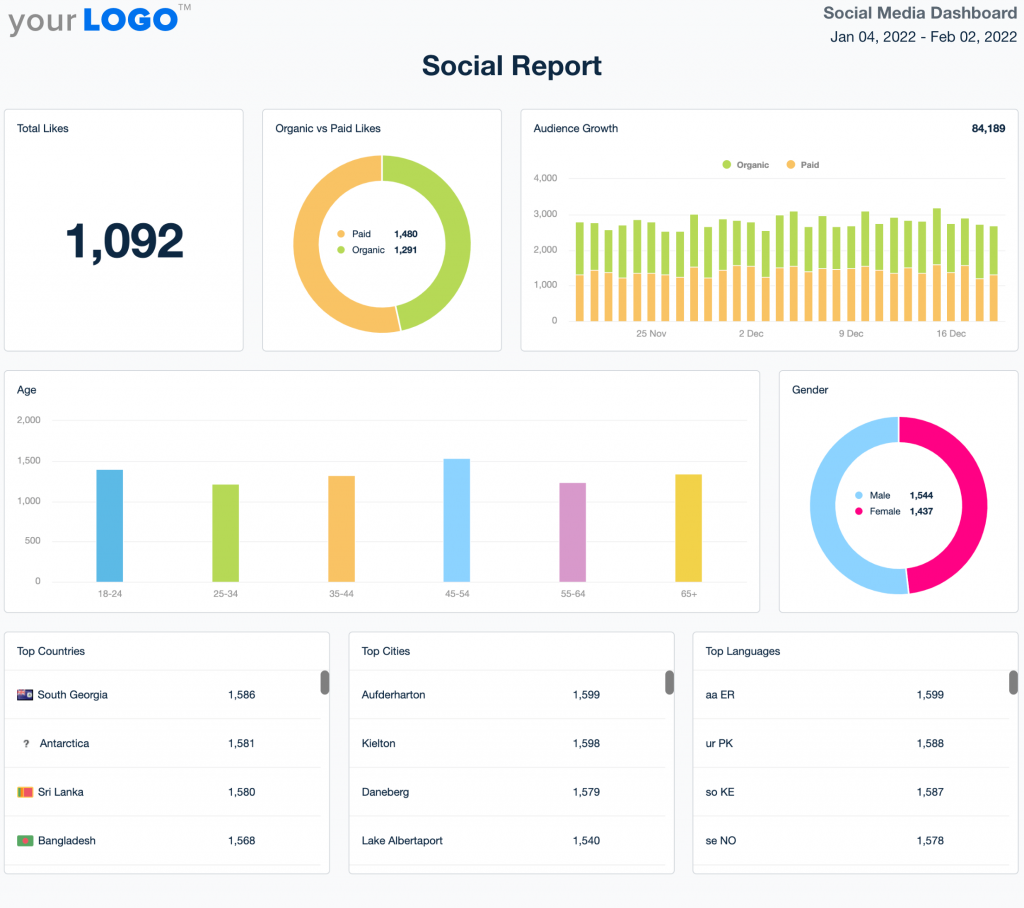
1. Follower growth
Report the increase in the number of followers. For example, “We are gaining 800 new followers every week.” The number of followers depicts the popularity, reach, and brand awareness.
As the number of followers grows on your social media profile, your influence widens in terms of the number of people you shall potentially reach and the perceptions others have of you.
Many social media reporting tools simplify social media reporting. You can view all the data required for your reporting in a single social media reporting tool instead of undergoing the tiresome process of logging into multiple social media analytics tools to collect the information you need and compile a report.
2. Influencer report
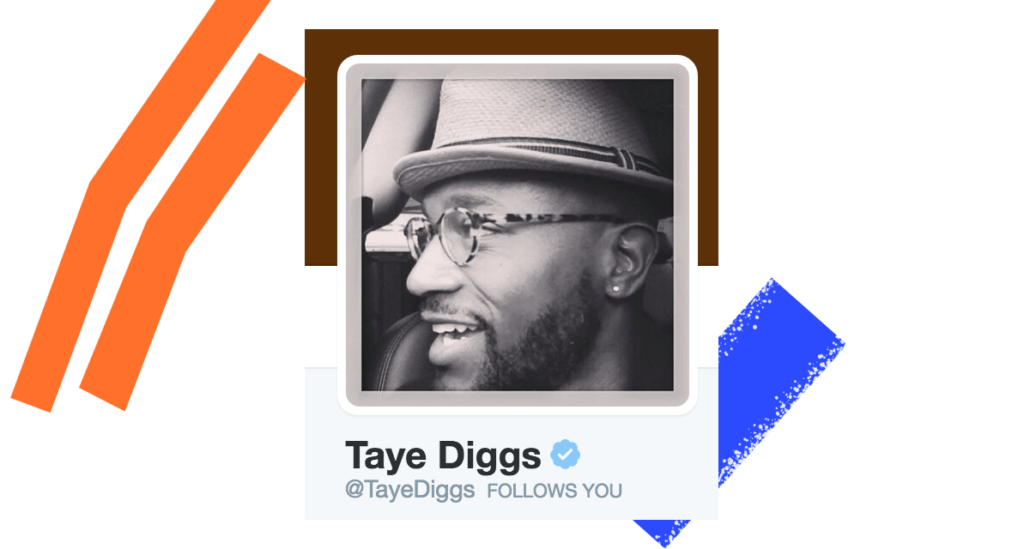
It’s great to have a celebrity or someone influential follow you. The value of having an influencer follow you is that any post of yours has an opportunity to reach a considerable number of users. Influencers among your followers mean that you are being taken seriously by famous personalities.
It is advantageous to design your social media marketing campaigns that interest the influencers in sharing them on their profile, and your marketing campaigns reach thousands of their followers.
SocialRank and Followerwonk are tools that help you to identify influencers on Twitter. Sign up on these websites and connect your accounts. Identify your followers who have a massive following and add that information to your social media report to devise your future social media marketing strategy.
3. Volume of posts
One of the critical reports people run is the number of posts to a social network. You would be able to check the number of posts with the help of social media reporting tools. Log into your social media reporting tool, select your profile, choose metrics breakdown, and select posts.
4. Reach rate
Reach is the number of people who might view your posts. Any social media reporting tool displays the reach per post for Twitter, Facebook, and Instagram. To get the reach rate, calculate reach per post by totaling reach and dividing it by the number of followers.
Reach rate (Percentage of followers that have seen your post) = Reach per post / Total followers.
5. Engagement
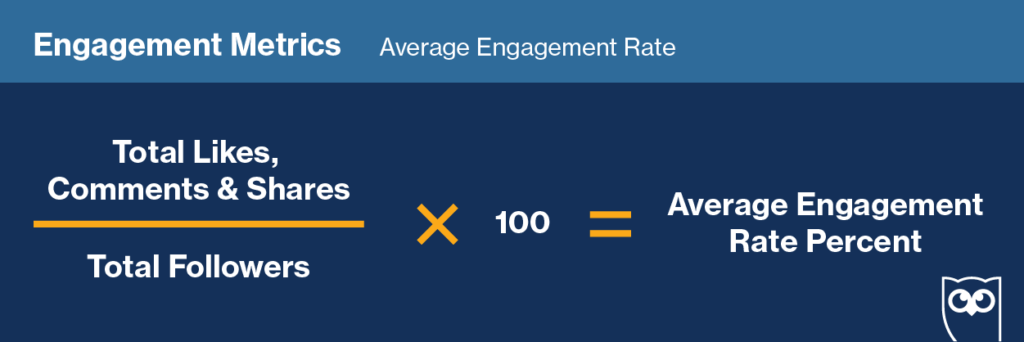
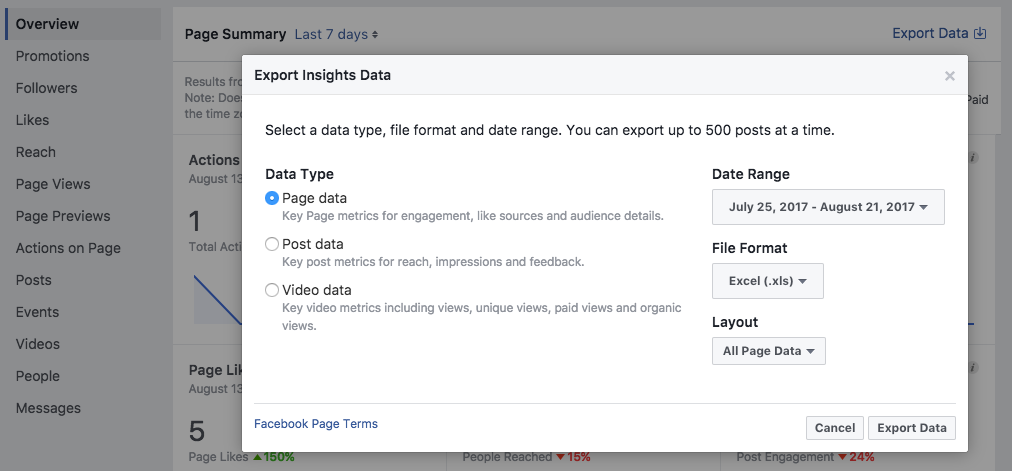
Total engagement is the sum of likes, re-shares, clicks, or comments. Total engagement gives you an idea about the effectiveness of your post. Good engagement equals good sharing—export data from your social media reporting tool, Facebook or Twitter.
Engagement per post gives you a clear picture of how engaged people are with your content. You can calculate engagement per post by dividing total engagement by the number of posts.
Engagement per post = Total Engagement/ Number of posts.
6. Clicks
Clicks are a direct metric that you can connect back to your website. When your boss looks at an impressive number of clicks, they will conclude that you did a good job writing an excellent headline and created a beautiful visual.
To calculate total clicks, add the clicks from each post during the required date range. To calculate clicks per post, divide total clicks by the number of posts.
Clicks per post = Total Clicks/ Number of posts
7. Social referral traffic
Social referral traffic is a brilliant way to showcase how successful your social network has been in driving traffic to your website. This includes links that you shared personally and links shared by others on social media.
How to Explain Social Media Metrics
You have put in a lot of effort, pulled data from different analytics tools, collated the data, and compiled a report. The challenge is to present it so that your boss or clients easily understand the information when they see it. Choose the statistics that matter the most to your client or boss and present them in a way they understand.
1. Include the social media metrics that matter to your boss or client
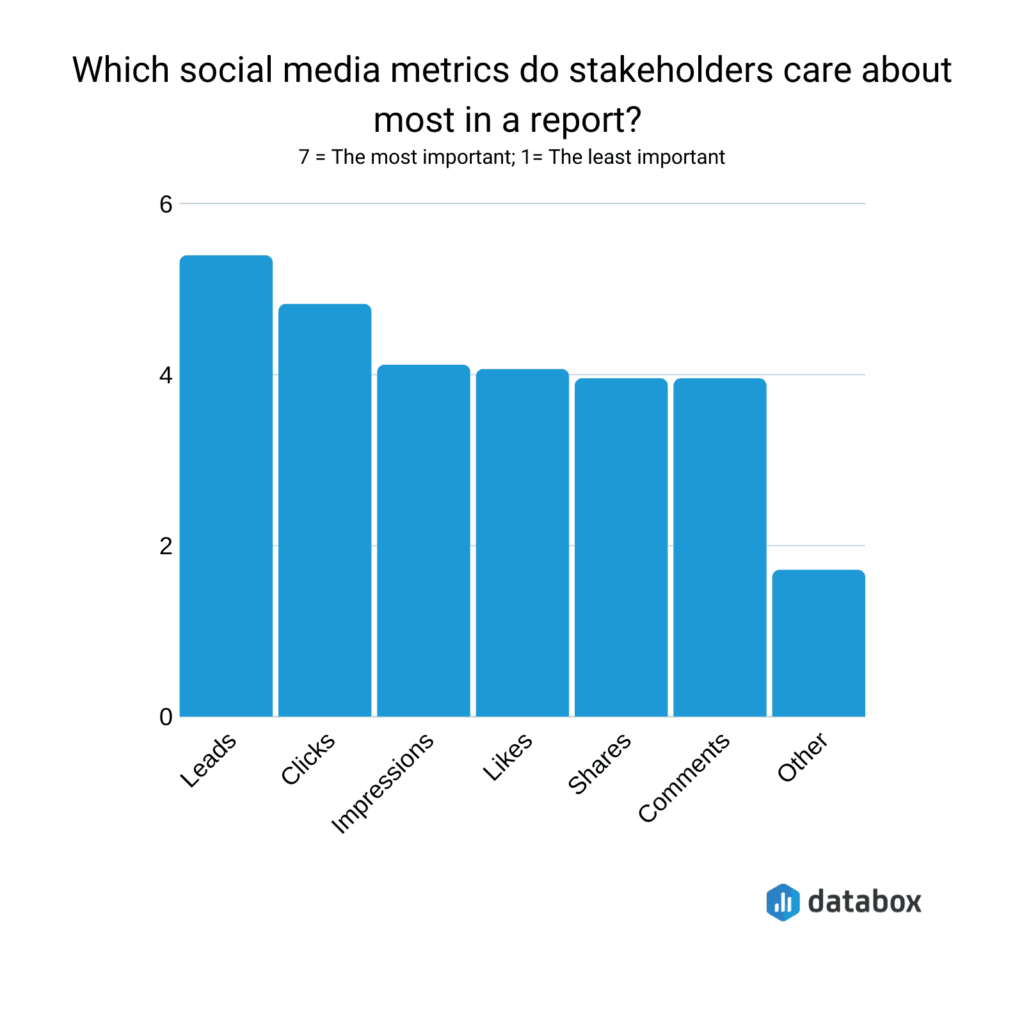
- When your boss or client looks at the number of followers, it gives them insights into the popularity, brand awareness, and reach.
- The growth rate gives them a fair idea of the number of people you will reach and the perception others have of you.
- Engagement provides them with information about likes, comments, and shares on a post.
- Reach shows the size of the target audience you are corresponding with.
- Conversions provide them with information about the number of people who reached the desired result: buying the product, completing a form, signing up for email newsletters, or any other objective you have set for your campaign.
- Include any social media metrics specified by your boss or client or those that interest them.
2. Use visual aids
People understand data better when it is represented visually. Use graphs, pie charts, and tables to describe critical statistics in your report to make it easier to understand. They are pleasant to look at instead of just text and numerals.
3. Set realistic goals
Set realistic goals before you initiate a new social media marketing campaign. Do you need more engagement, better reach, more followers, or increased sales? Include critical objectives in your report so that readers can identify whether the goals are met.
4. Choose the correct frequency.
Depending on the objectives of your social media campaign, you will need to set a proper interval for your reports to be sent out. Does your boss want to see the social media report weekly, monthly, or quarterly? Also, you would need to send the report in their preferred manner. Send the report by phone or email, or you deliver the report personally.
5. Customize a template for your social media report
A social media report in 2021 has become an essential part of social media marketing, and nearly thousands of companies use social media reporting. Plenty of pre-designed social media reporting templates are available online, some are available free of cost, and others are available for a small one-time fee.
Find a layout that suits your reporting needs, customize it with your company logo, and include the metrics not already present in the template. It will save you a lot of time and effort, and you will still be able to create the best social media report.
In Summary
All in all, once you understand the various metrics you are looking at for your social media campaign, you will be in the right position to explain it to your boss or client.
Use the above ideas on how to explain the report well and comprehensively, and watch your social campaign grow.
Key Takeaways
- Data gathered around parameters such as appropriate post length and the most engaging subjects for the company’s customers drives more efficient information development for each social channel.
- Social media reports offer corporations an understanding of the best times and days of the week to communicate with existing and prospective customers and help them better understand which themes resonated on a given day.
- A social media report is customized to meet these demands, drawing on a wealth of existing evidence to integrate its social media presence with its goals.
- Having a social media report allows you to explain the social media progress. You can select the statistics that are important to you and present them in an easy-to-understand format.
- Your options will be determined by your company’s social networks, your marketing plan, and what your stakeholders want to see. Choose metrics from which you can learn and that will help you make decisions for current and future campaigns.
FAQs
1. Define your goals, objectives, KPIs
2. Sort out the social media channels
3. Listen to your audience
4. Analyze the performance
5. Measure your reach and engagement
6. Present your results clearly
No. of followers
Visits and clicks
Engagement
Best performing posts
Volume of posts
A social media report offers the mean value of the overall engagement and performance of a brand’s/individual’s social media channels. Such as Instagram, Linkedin, Twitter, Facebook, etc.
1. Attractive: Eye-catching images pique readers’ interest in their content. Increase engagement by using colors, graphs, and different themes to reflect your company.
2. Client-friendly: Your social media report shouldn’t have an unending number of columns and rows. It should be digestible and understandable in a short period.
3. Quickness to share: You have a limited amount of time. It should only take a few clicks to send your social media report to your supervisor or a client for assessment.
Social media reports may assist your business in determining period-specific ideal times and days of the week to communicate with current and future consumers and which themes resonate on a given day.
Latest Blogs
Explore how Google’s 2025 AI search updates triggered ranking chaos. Learn actionable strategies to adapt your SEO for AI Overviews, zero-click searches, and SERP volatility. Stay ahead now.
Learn how to rank on AI search engines like ChatGPT, Perplexity, and Gemini by optimizing your content for authority, structure, and relevance. Stay ahead in AI-driven search with this strategic guide.
Explore the best healthcare SEO services for your medical practice. Improve online visibility and effectively reach more patients in need of your services.
Get your hands on the latest news!

Similar Posts

Artificial Intelligence
5 mins read
Enhance Your Writing Efficiency: Must-Have Content Writing Tools for Marketers

Marketing
5 mins read
9 Key Strategies To Increase Twitter Reach

Marketing
6 mins read