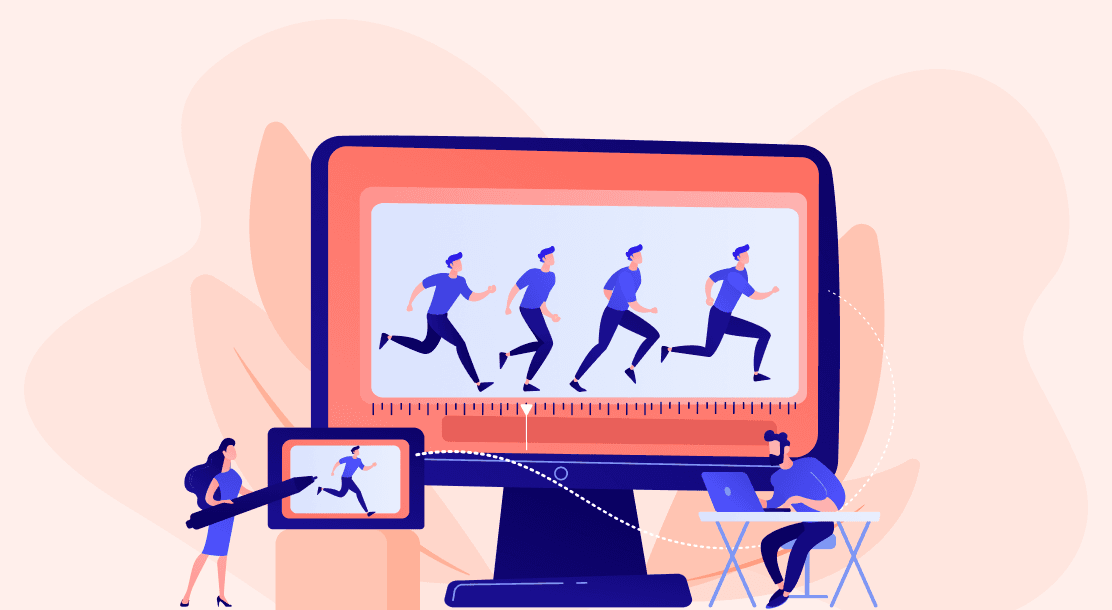
Whether GIFs or videos, animated infographics, also known as infographics motion graphics, are creating a storm on social media. What’s so compelling about animated infographics? In a nutshell, they are a way to visualize information through a clever combination of graphs, charts, imagery, illustrations, text, and other elements to add movement to a static image.
These days, designers rely more on animated infographics to make complex information easily comprehensive. To communicate ideas better and keep target audiences engaged, animated infographics are gradually replacing static content.
How to Create Interactive Animated Infographics
Animated infographics are one of the most effective mediums for a content marketer. This format lets you create compelling content, which gets shared quickly on social media.
Here are a few steps to making interactive infographics:
1. Collect and convey data in a compelling manner
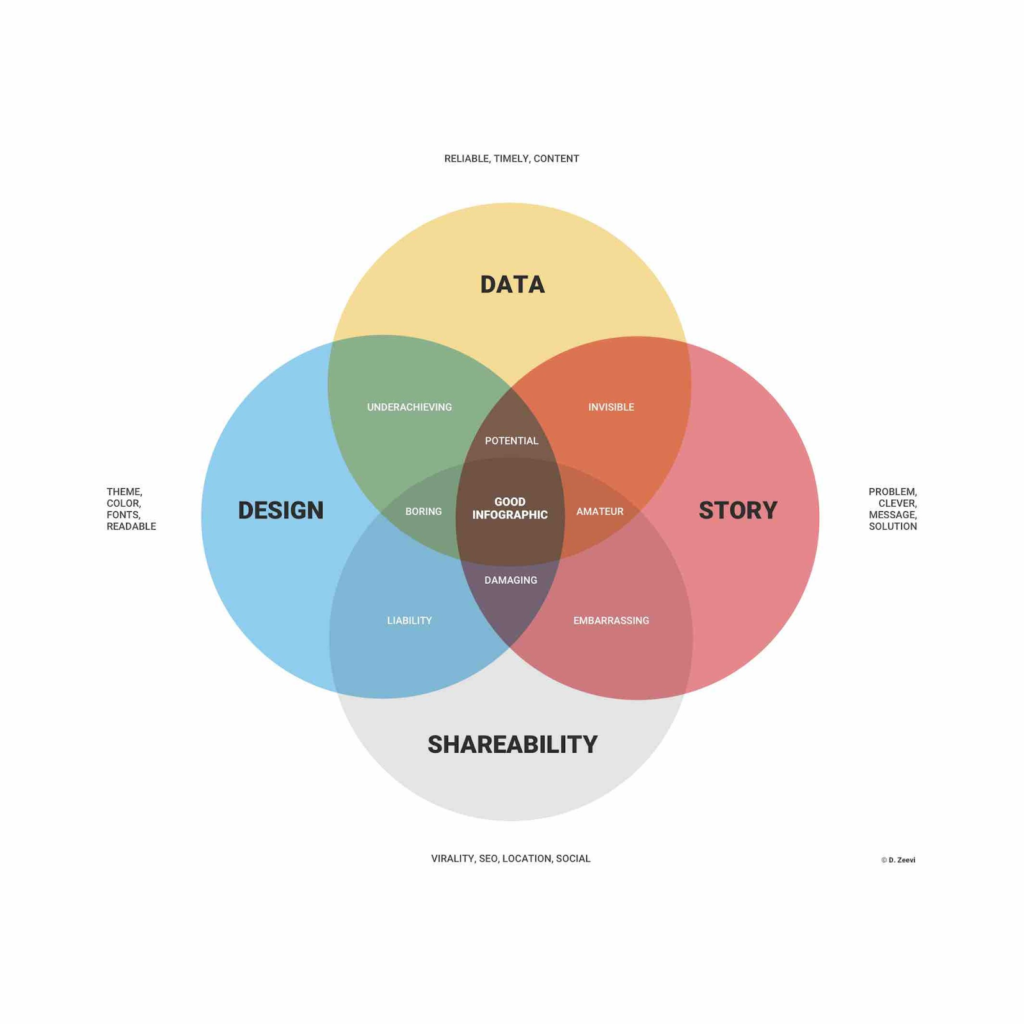
First, collect data to create interactive infographics and make it more exciting to grab your target audience’s attention. Find ways to transfer it after making it a lot more presentable. Plain, uninteresting infographics will not create interest or engagement. You need to tell a story with your data, which you can achieve by using excellent language and clever visuals.
2. Add compelling visuals
In infographics, the term “graphic” means visuals, adding life to your text, which will otherwise be mere facts and statistics. Animated infographics can be created by adding exciting visuals to grab users’ attention and retain it. You can easily sustain your data by adding images, which can be actual photos, illustrations, or anything visual, but ensure that your theme is consistent. Consistency must be maintained in form, shape, color, and tone.

3. Add interactive elements
Once the text and visuals are ready, it is time to identify the interactive elements that best go with them to complement and enhance them. If you wish to educate your target audience on a specific subject, you can create an interesting quiz and rate the participants.
Conducting an interesting survey always attracts many people keen to answer a few quick, meaningful questions. You can include a heat map and some significant landmarks if you are presenting geographic data.
You have several free tools for creating interactive infographics. Infogram, VisME, and CopyPress are some tools you can use.
Benefits of Making Animated Infographics
There are several benefits of creating animated infographics. We list the top five below.
1. Grabs your target audience’s attention
Today, most publishing and social media platforms support videos, and GIFs, besides static images. You have so many platforms to play around with, and adding life to static infographics to make them engaging helps grab your audiences’ attention. Even more so on social media, when you try to market content as interactive animation, the viewership increases dramatically.
2. Marketing becomes more effective
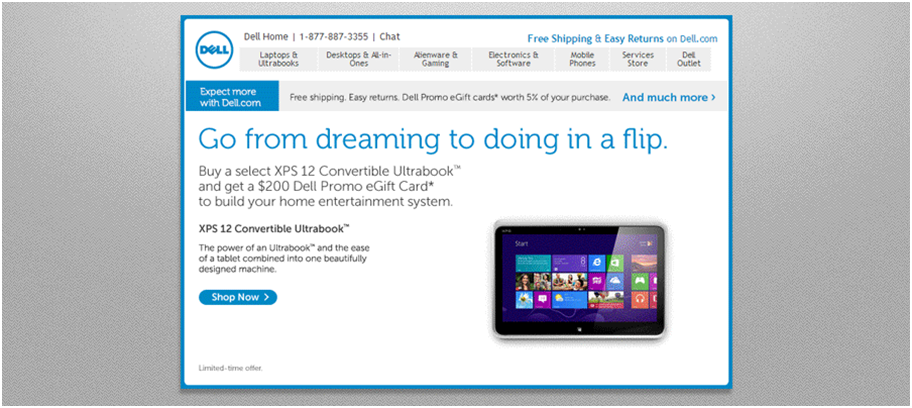
Another significant benefit of animated infographics is that it simplifies your marketing efforts and makes them more effective. Even successful companies like Dell relied on adding GIFs to their email marketing campaigns to make them more effective and generate a 6% increase in the open rate and a 42% increase in the click rate. Moreover, the conversion rate rose by 103%, and the revenue by 109% because the content was so catchy and compelling.
3. Your content is lapped up
Your content will be consumed immediately, not just because it is compelling but because it is easier to comprehend. Converting your static infographics into videos, GIFs, and other infographics motion graphics makes them easily digestible for your target audience.
4. Keeps viewers engaged
Interactive infographics allow your viewer to become a part of the story and resonate with it quickly. Even a slideshow is interactive as the viewers cannot progress to the next slide without clicking. Such actions kindle the audiences’ curiosity, making them interactive and more interested.
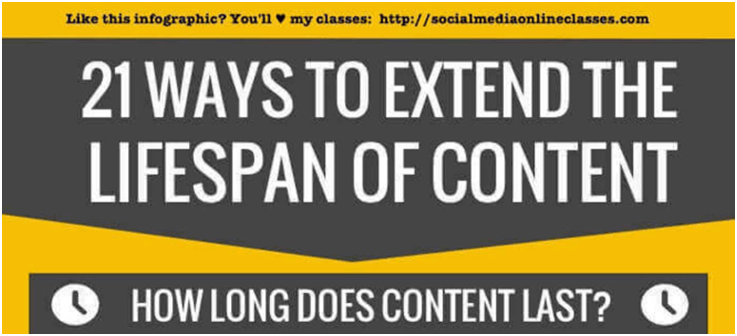
5. Your content remains evergreen
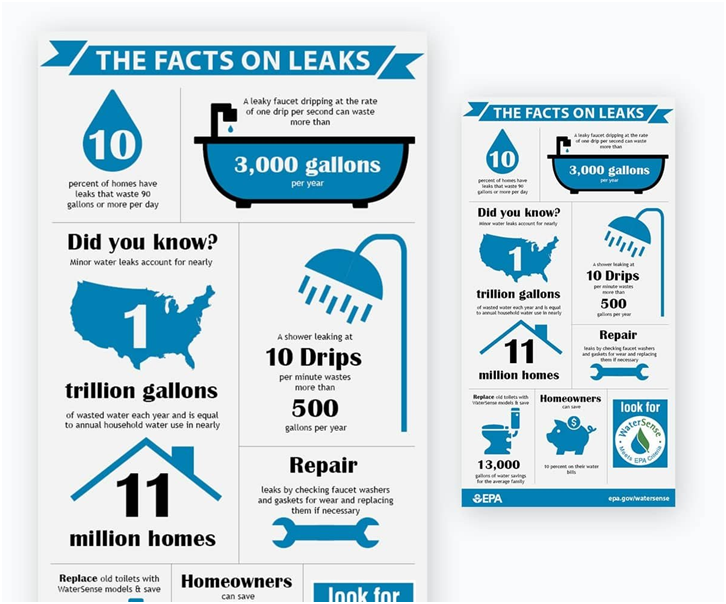
Interactive infographics add to the shelf life of your content, making it evergreen. You can easily repurpose your static infographics by adding visuals and converting them into interactive animation pieces, which can be promoted on several platforms to increase your conversion rates by catering to new audiences. You can recycle old e-books into exciting interactive infographics with minimum effort.
How Infographics Give Meaning To Your Content
Animated infographics make complex contexts easy to understand through visualization (diagrams, charts, and graphs). Balanced use of text and graphics can help explain concepts better. That’s why marketers are turning to interactive animation, which helps them market their content better.
Interactive infographics can help with decision-making and speeds up the process considerably. Information is processed faster with visuals, which helps people make decisions faster. It helps present complex ideas in a simple and easy-to-understand format.
Moreover, your content gets better exposure, thanks to interactive infographics. While your ideas in the form of interactive animation can never be copied per se, they can be shared by others quickly, helping with better conversions.
In the End
The points mentioned above should help you understand animated infographics better and realize their potential impact on your textual or static content. Adding visuals to create interactive animation helps broaden the sphere of your content, which is easy to understand and digest.
Key Takeaways
- There are several free, easy-to-use interactive animation tools that even non-designers can use with consummate ease.
- Adding visuals to your static infographics makes them more exciting and easily understood.
- Content marketers should try adding new methods to their content marketing activities, and trying out interactive infographics is a step in the right direction.
FAQs
One of the best ways to visualize information is through animated infographics. It uses a combination of illustrations, graphs, charts, imagery, and text, some of which are animated to give movement to create an extra effect.
Infographics are an effective way of conveying your message in a visually pleasing way. Animated infographics help grab the attention of your target audience and sustain it. Infographics can also be used with other web elements to achieve higher rankings on search engines. Moreover, it is easy to make a complex topic easily understandable by using animated infographics to explain a topic.
You need first to create the right layer structure using a tool like Illustrator. You must then import the static infographics you want to convert to an interactive one using the Animaker infographics tool or Animator. It is easy to create interactive infographics by adding interactivity, after which you can export the interactive infographics online.
You can make your logo more appealing by adding an element of motion graphics to it. While animation can provide more excitement to a graphic image, animated infographics are one of the easiest ways to convey information.
That is why animated infographics are shared regularly on social media and other platforms for business promotion. However, animation forms a critical part of your distinct corporate identity, whereas infographics are suitable for educational scenarios and can be used as a learning aid.
1. Process infographics
2. Timeline infographics
3. Statistical infographics
4. Comparison infographics
5. List infographics
6. Geographic infographics
7. Information infographics
8. Resume infographics
Latest Blogs
Explore how Google’s 2025 AI search updates triggered ranking chaos. Learn actionable strategies to adapt your SEO for AI Overviews, zero-click searches, and SERP volatility. Stay ahead now.
Learn how to rank on AI search engines like ChatGPT, Perplexity, and Gemini by optimizing your content for authority, structure, and relevance. Stay ahead in AI-driven search with this strategic guide.
Explore the best healthcare SEO services for your medical practice. Improve online visibility and effectively reach more patients in need of your services.
Get your hands on the latest news!

Similar Posts

Design
7 mins read
15 Best Firms Offering Design Services in India
Design
5 mins read
All You Need to Know About Data-Driven Design

Design
6 mins read