The Essential List Of Content Marketing Statistics And Data

A content marketing plan based on quantitative and qualitative data that identifies a target audience’s goals, motivations, and activities produces data-driven content. In other words, data assists you in creating and fine-tuning your buyer personas, which are then used to create your strategy and execute your content. Every encounter a potential consumer or buyer makes with your brand is tracked and examined so you can keep refining your understanding of them.
Let’s take a look at the most important content marketing data to influence the biggest trends of 2023.
Content Marketing Statistics for Strategy

The following are the most significant content marketing stats for strategy:
- Increasing sales, fostering customer relationships, and raising brand recognition are the top three main objectives of content creation (eMarketer).
- According to Demand Metric, content marketing generates nearly three times as many leads and costs 62% less than outbound marketing.
- According to eMarketer, 72% of North American marketers who are most effective track the results of their content marketing.
- Even if it means posting less often, 83% of marketers (Hubspot) believe it is better to concentrate on content quality rather than quantity.
B2B Content Marketing Statistics
The following are the most significant content marketing statistics in the B2B marketing space:
- Just 7% of B2B marketers (a 3% rise from last year, according to CMI) do not intend to create a content marketing strategy.
- The majority of B2B marketers (83%) and those who cover underserved topics/stories (72%), according to CMI, aim to set themselves apart from the competition.
- Short articles (fewer than 3 thousand words), films, and virtual events/webinars/online courses (CMI) were the top-performing B2B content assets in 2021 and 2022.
- 87% of B2B marketers place a higher priority on the informational requirements of the audience than on the company’s sales/promotional messages (CMI).
- 96% of B2B content marketers use LinkedIn (CMI).
- The majority of B2B marketers (67%) employ channels for paid content distribution (CMI).
- When developing content, 78% of B2B marketers use keyword research for SEO (CMI).
Insert banner on pepper content marketing platform
B2C Content Marketing Data
The following set of content marketing statistics will help you compare B2B and B2C marketing:
- 5% of B2C marketers said they do not intend to have a content marketing strategy.
- The informational requirements of the audience are given priority by 65% of B2C marketers over the company’s sales and promotional communications (CMI).
- In 2021 and 2022, brief articles, films, and data visualization/3D models had the best performance of all B2C content assets. (CMI)
- Facebook (63%), LinkedIn (53%), and Instagram (39%) are the three sites that B2C marketers who use free social media platforms say delivered the best overall content marketing outcomes (CMI).
- The percentage of B2C marketers that don’t use paid content distribution channels is only 22%.
- When developing content, 73% of B2C marketers use keyword research for SEO (CMI).
Organic Search Statistics
The majority of content marketers conduct keyword research and spend money on SEO. In other words, they spend money on organic search, and this is what the data looks like:
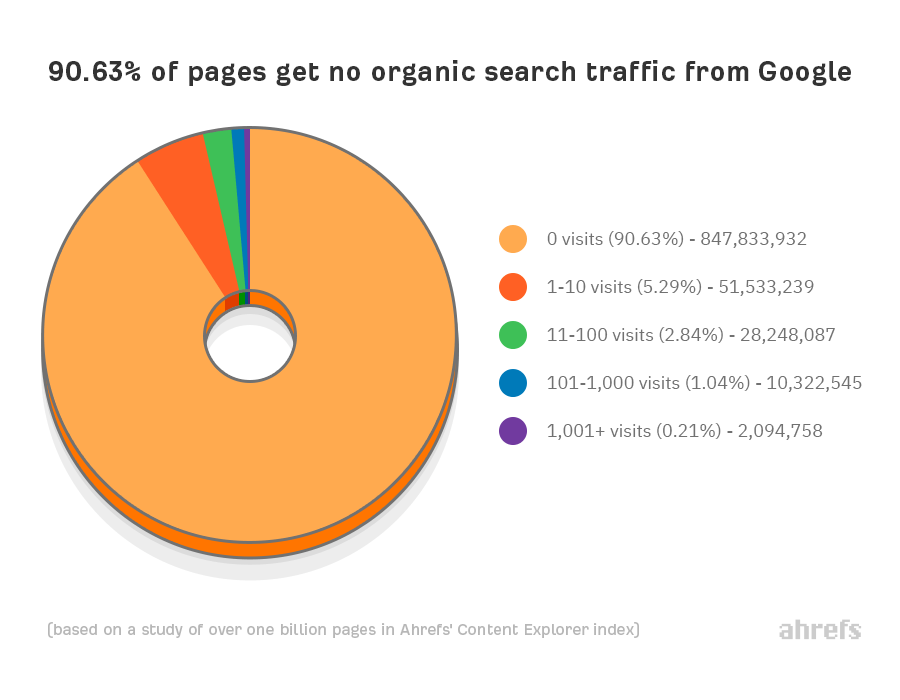
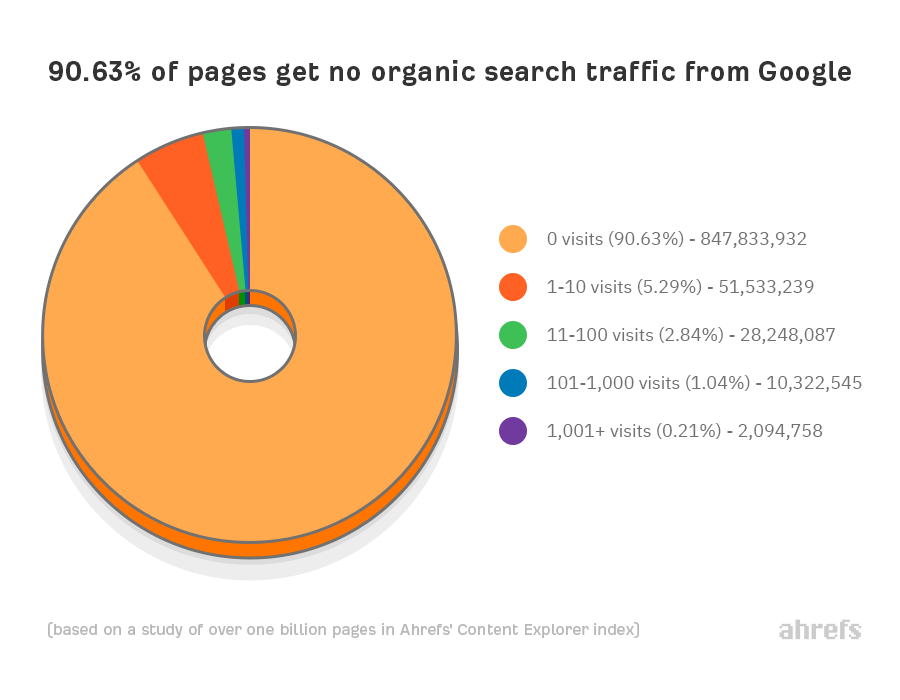
- 90.63% of pages receive no organic Google search traffic.
- According to Brightedge, 68% of online activities start with a search engine.
- Instead of starting with a branded search, 71% of B2B researchers do a generic search (Google).
- To make the best decision possible, 53% of consumers claim to always perform their research before making a purchase (Google).
- Within a year of publication, just 5.7% of pages will appear in the top 10 search results (Ahrefs).
- Mobile devices account for over two-thirds of all online searches worldwide (Perficient).
- According to HubSpot, 69% of marketers actively invest in SEO.
Blogging Statistics

Selected data for the main component of several content strategies look like this:
- Online reading is rarely done. People scan significantly more frequently than they read sentences word for word. They merely want to select the data that is most relevant to their present requirements (Nielsen).
- According to Demand Metric, 70% of individuals prefer reading blogs to watching traditional commercials.
- Out of the 1.9 billion websites in the globe, there are more than 600 million blogs as of right now. Over 2.5 billion blog entries are written by their authors every year, or more than 6 million every day (hosting tribunal).
- The most popular content types are how-to articles (77%), followed by news and trends (49%), and then manuals and ebooks (47%), according to Statista.
- According to Statista, only one-third of bloggers routinely review their blog traffic analytics.
Video Content Statistics

According to Hubspot, for the third consecutive year, video content will dominate the market in 2023. Video marketing appears to be a need rather than a nice-to-have.
- 70% of viewers who saw a product on YouTube made a purchase. (Google)
- According to 78% of individuals (Wyzowl), watching a video persuaded them to buy or download a piece of software or app.
- In a typical week, YouTube reaches more adults between the ages of 18 and 49 than all cable TV networks combined (Google).
- According to Hubspot, live streaming and short-form videos (TikTok, IG Reels) were the most successful social media forms in 2022.
- According to video consumers, content that speaks to their passions matters 1.6 times more than content with great production value (Google).
- According to Wyzowl, 86% of companies utilize video as a marketing strategy.
- According to Wyzowl, 96% of people have watched explainer videos to understand more about a good or service.
- According to Wyzowl, 88% of consumers expected to watch more brand videos in 2022.
Podcasts Statistics
Companies like Basecamp, Slack, and Shopify have already made investments in producing branded podcasts. These figures demonstrate that businesses should at the very least think about podcast advertising.
- According to Statista, podcast advertising spending in the US is anticipated to climb by 27% from 2022 to $2.2B in 2023.
- By 2022, 62% of Americans (Edison Research) were podcast listeners.
- According to Edison Research, the percentage of people aged 35 to 54 who listen to podcasts regularly has increased from 39% in 2021 to 43% in 2019.
- According to Podcast Insights, 80% of podcast listeners finish all or most of each episode.
- According to Edison Research, weekly podcast listeners consume an average of eight episodes.
How Can Data-Driven Content Boost Your Marketing Efforts
Based on your daily activities, you presumably produce a sizable amount of data. Among other things, customers browse your website, engage with you on social media, and make purchases. What relevance does any of this have to your content strategy, then?
Well, content analytics applies to a lot of that data. Understanding the content that appeals to your audience will help you choose future themes and forms. You will require a single source to combine all streams and offer insights in real-time to optimize.
What more do you require to implement a data-driven content strategy, then? Data may be a great tool for the creative process in addition to tracking the effectiveness of your content.
Each and every content marketer must accept and use data. You do not need to make assumptions when using data. Instead, you will have a clear understanding of the issues that are important to your audience, and that is how you attract and retain clients.
Key Takeaways
- Data-driven content marketing has seen a rising trend over the last three years.
- Data-driven content is produced by a content marketing strategy built on quantitative and qualitative data that pinpoints the objectives, drivers, and behaviors of a target audience.
- The most significant channels of content distribution as per the content marketing stats include B2B, B2C, blogging, videos, podcasts, and organic search.
- Data may be a very useful tool for the creative process as well as for determining how effective your material is.
FAQs
A content marketing plan that has been developed based on quantitative and qualitative data that identifies a target audience’s goals, motivations, and activities produces data-driven content.
You can gain crucial business intelligence about what kind of content works best to move prospects farther down the sales funnel with the use of data-driven insights.
Only 26% of businesses claim to have established a data-driven culture, pushing the other 73% behind.
Every industry today uses big data, but the media and entertainment industry wins for predictive analytics.
Visual content, according to the majority of marketers polled, is an important part of their marketing approach.
Latest Blogs
Explore how Google’s 2025 AI search updates triggered ranking chaos. Learn actionable strategies to adapt your SEO for AI Overviews, zero-click searches, and SERP volatility. Stay ahead now.
Learn how to rank on AI search engines like ChatGPT, Perplexity, and Gemini by optimizing your content for authority, structure, and relevance. Stay ahead in AI-driven search with this strategic guide.
Explore the best healthcare SEO services for your medical practice. Improve online visibility and effectively reach more patients in need of your services.
Get your hands on the latest news!

Similar Posts

B2C Marketing
5 mins read
Top Choices for Best Content Marketing Services in B2B Industries

Artificial Intelligence
5 mins read
How A Lead Generation Specialist Can Use AI-Powered Content Funnels to Drive Conversions

Artificial Intelligence
4 mins read