Blueprint for Successful Content Marketing Reporting and Dashboard

Content marketing has exploded in popularity among B2B startups lately, with more startups shifting budgets away from traditional tactics.
And it’s easy to see why—content marketing costs 62% less than traditional marketing and generates over 3x as many leads.
But even with all the apparent benefits, SaaS companies need help to make content marketing work. The problem is a need for tracking. Without proper data and reporting, teams shoot in the dark instead of using metrics to guide strategy.
This is where you need content marketing reporting tools.
In this blog, we’ll go through the critical steps for building reports that give you absolute clarity on your content marketing efforts. Let’s dive right in!
Why is Content Marketing Becoming Important for SaaS Businesses?
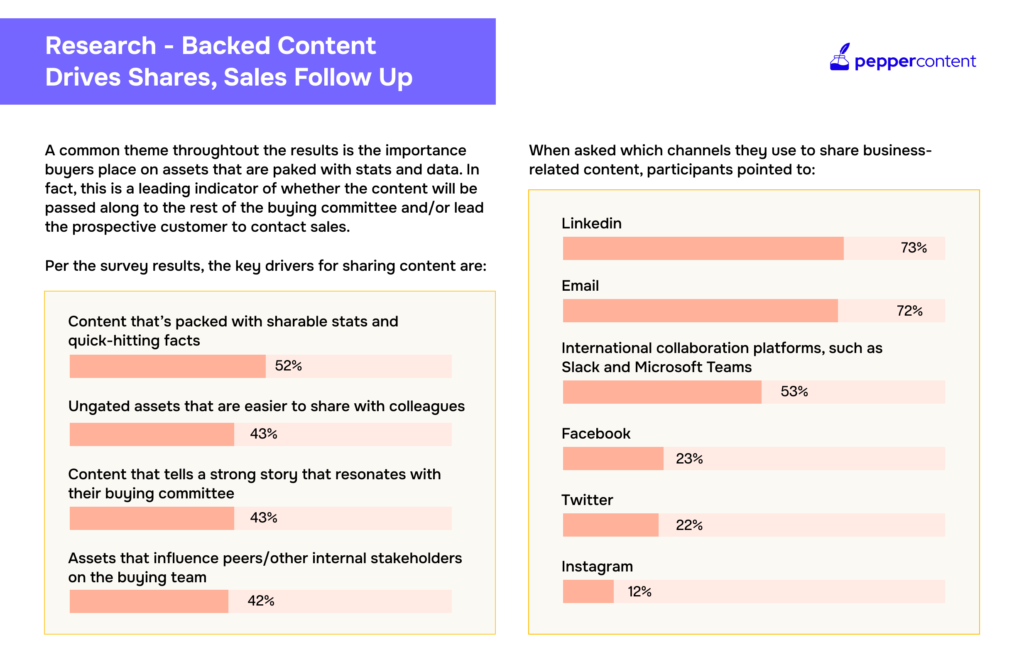
According to DemandGen’s 2023 Content Preferences Survey Report, 71% of B2B buyers download, research, and consume multiple content pieces and assets before making a final decision.
Of these, 65% of customers gravitate towards quick-hitting interactive assets like short-form blog and video content, infographics, etc.
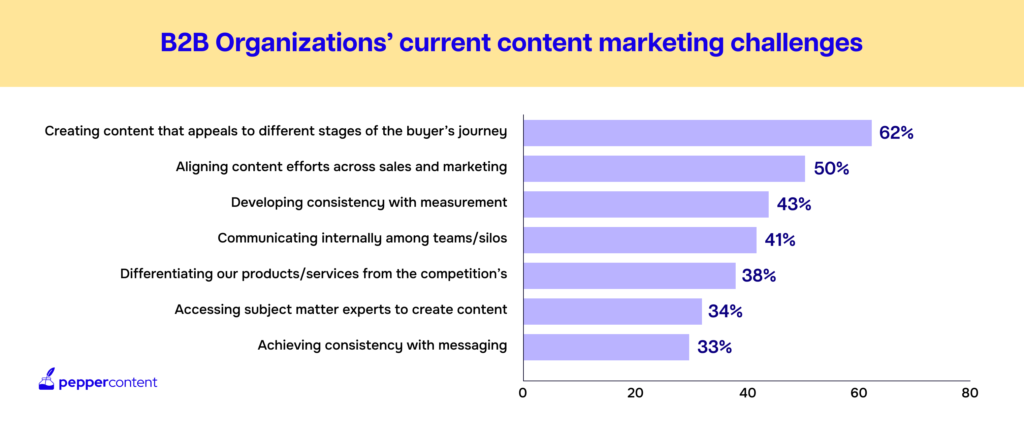
But more budget doesn’t guarantee success. The hard truth is that 41% of B2B companies find it difficult to communicate content marketing internally among teams.
This lack of clarity is why high-growth SaaS companies turn to content marketing dashboards—to connect content efforts directly to revenue influence.
Why You Need Content Marketing Reports and Dashboards
With content marketing’s fast-growing role, measurement can no longer be an afterthought. You need to quantify the content’s ROI.
“You can’t improve what you don’t measure.”—Peter Drucker
Here are five benefits of accurate content marketing dashboards:
1. Optimize and Refine Content Efforts
With a dashboard tracking real-time analytics, you can:
- Identify which topics resonate best with your audience
- See which content types and formats attract the most engagement
- Spot trends around high/low-performing channels and campaigns
- Locate areas where conversions are falling short
Armed with these insights, you can easily zero in on what’s working and refine what’s not.
For example, you may find your blog posts with videos outperform those without. This is a cue to your marketing team that videos are working, and they should focus more on them.
This data-backed optimization is impossible without proper reporting.
2. Get Executive Buy-In for Content Marketing
Many content efforts stall due to a lack of executive buy-in. That’s often because ROI is unclear.
With multi-touch attribution (a model measuring conversion influence across multiple touchpoints like ads, webinars, content, and sales calls), you can directly understand the influence of your content marketing efforts on your company’s bottom line.
Now, you have quantitative data that can be presented to your leadership team to increase the team budget for marketing spend.
3. Scale High-Impact Initiatives with Confidence
True optimization means scaling initiatives driving disproportionate results. But how do you determine which ones to scale?
A content marketing dashboard helps you do that by displaying your best-performing content on a single screen.
With data-backed visibility, you can shift the budget away from low-return channels and campaigns and towards high-ROI efforts. Resources flow to what demonstrably moves the needle, giving you more bang for your marketing spending.
4. Refine Future Strategy
When it’s time to map out next quarter’s plans, reporting clues you into what worked previously—and what didn’t.
You can see which content types, topics, and channels had the highest conversion rates. Use that intel to shape strategy, budget, and resources.
Suddenly, decisions around “What do we do next quarter?” become data-driven versus guesses.
5. Increase Collaboration Across Teams
Marketing no longer owns the buyer’s journey. To drive pipeline and revenue, you need help from Sales, Customer Success, and other departments. And according to Content Marketing Institute’s B2B marketer survey, 50% of in-house marketers face challenges when it comes to aligning teams.
Shared dashboards give every team visibility into content’s impact on the business. This motivates them to help nurture and promote content that fuels their shared goals.
Without clear reporting, content becomes a siloed marketing initiative. Accurate analytics better connects efforts across the revenue organization.
Now that we’ve explored the pivotal benefits of measurement let’s examine how to build reporting that transforms data into action.
Designing Optimal Content Marketing Reports and Dashboards
Great dashboards simplify complex data into intuitive, actionable insights. Follow this 4-step approach:
Step 1: Identify Metrics Aligned to Goals
The first step is choosing which metrics to track. This requires aligning KPIs to your goals.
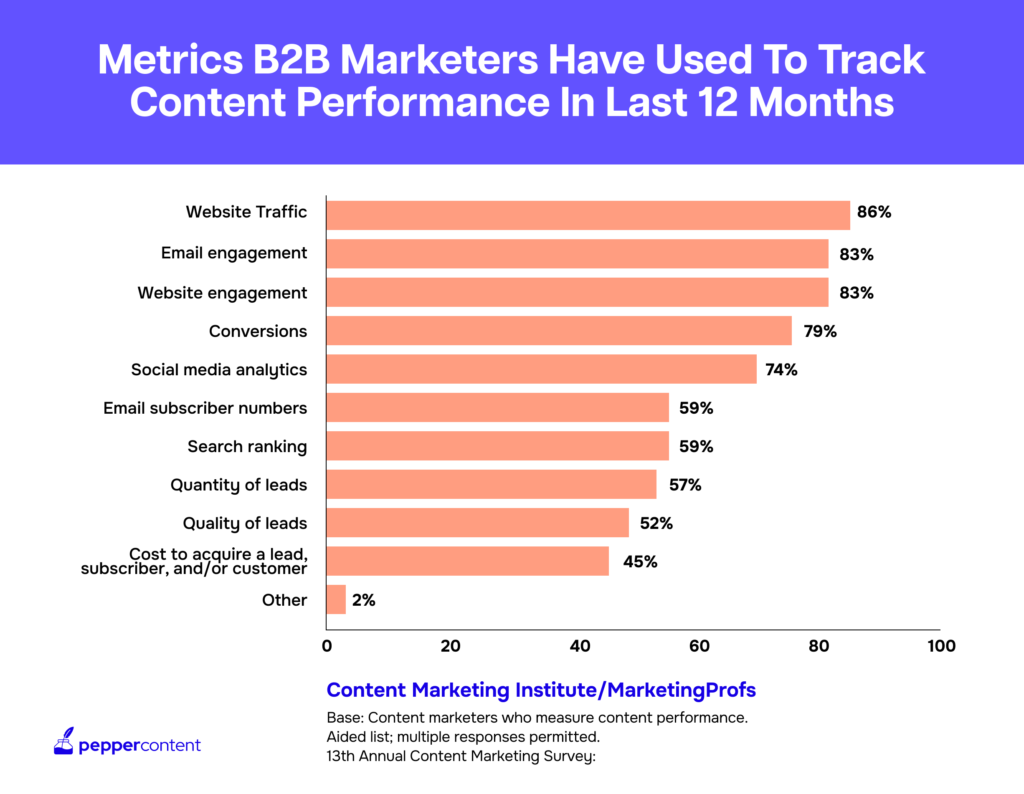
Some of the most useful metrics to start with are:
- Traffic data: Pageviews, unique visitors, etc. Measures overall eyeballs on content.
- Customer engagement metrics: Time on page, scroll depth, repeat session rate. Signals content relevance.
- Conversion metrics: Email subscribers, downloads, chat starts, free trials, won deals. The all-important business outcomes.
- Social metrics: Shares, links, embeds. Tracks content amplification.
Prioritize “business value” metrics like pipeline influenced and sales attributed. These prove the content’s revenue worth.
Avoid vanity metrics (measurements that sound positive but don’t actually indicate performance or business value) like social media likes that sound positive but don’t indicate performance. Stay laser-focused on data tied to goals.
Step 2: Use Templates to Get Started
You don’t need to start from scratch. Take advantage of the pre-built report templates to accelerate setup. Databox and SEMRush have a few great marketing report templates you can begin with.
However, remember that templates are designed to give you a starting point—something to help you skip the blank page syndrome. You need to modify and iterate over the reports to make sure they accurately showcase the marketing data that your business cares about.
Step 3: Optimize Design for Clarity
How you visualize data is just as important as the metrics themselves. Follow these design best practices:
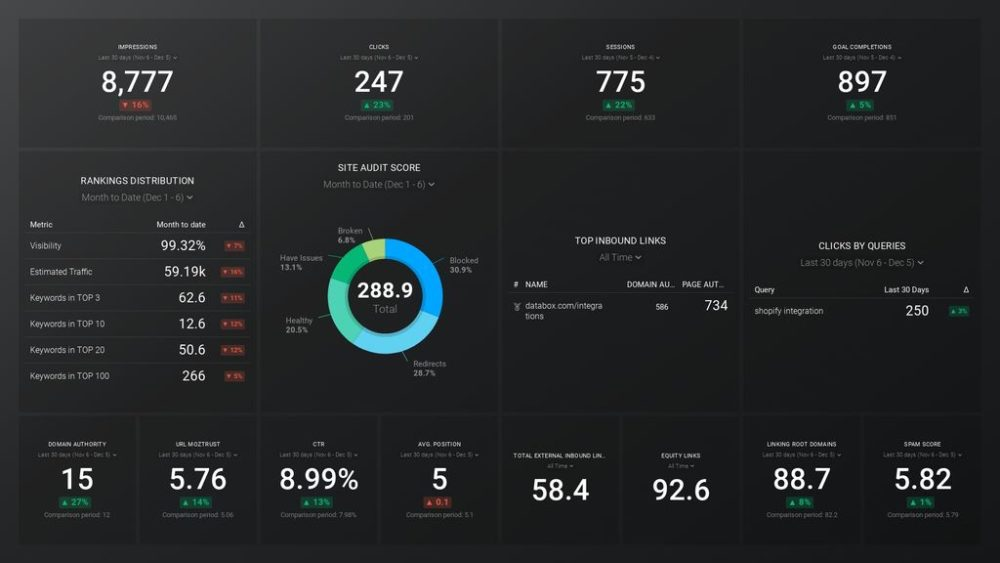
- Prominently display your key metric(s). Put the main thing you want viewers to see front and center through elements like big numbers, summary boxes, and large charts.
- Limit metrics to the essentials. Avoid flooding viewers with endless vanity metrics. Stick to KPIs directly aligned to goals. Less is more when it comes to dashboard metrics.
- Use summaries and drill-downs. Summarize insights at the top, then enable viewers to drill into details. Don’t make critical trends lost in noise.
- Optimize visuals. Get creative with charts, graphs, statuses, and other visuals that make data digestible. Familiarize yourself with visualization best practices.
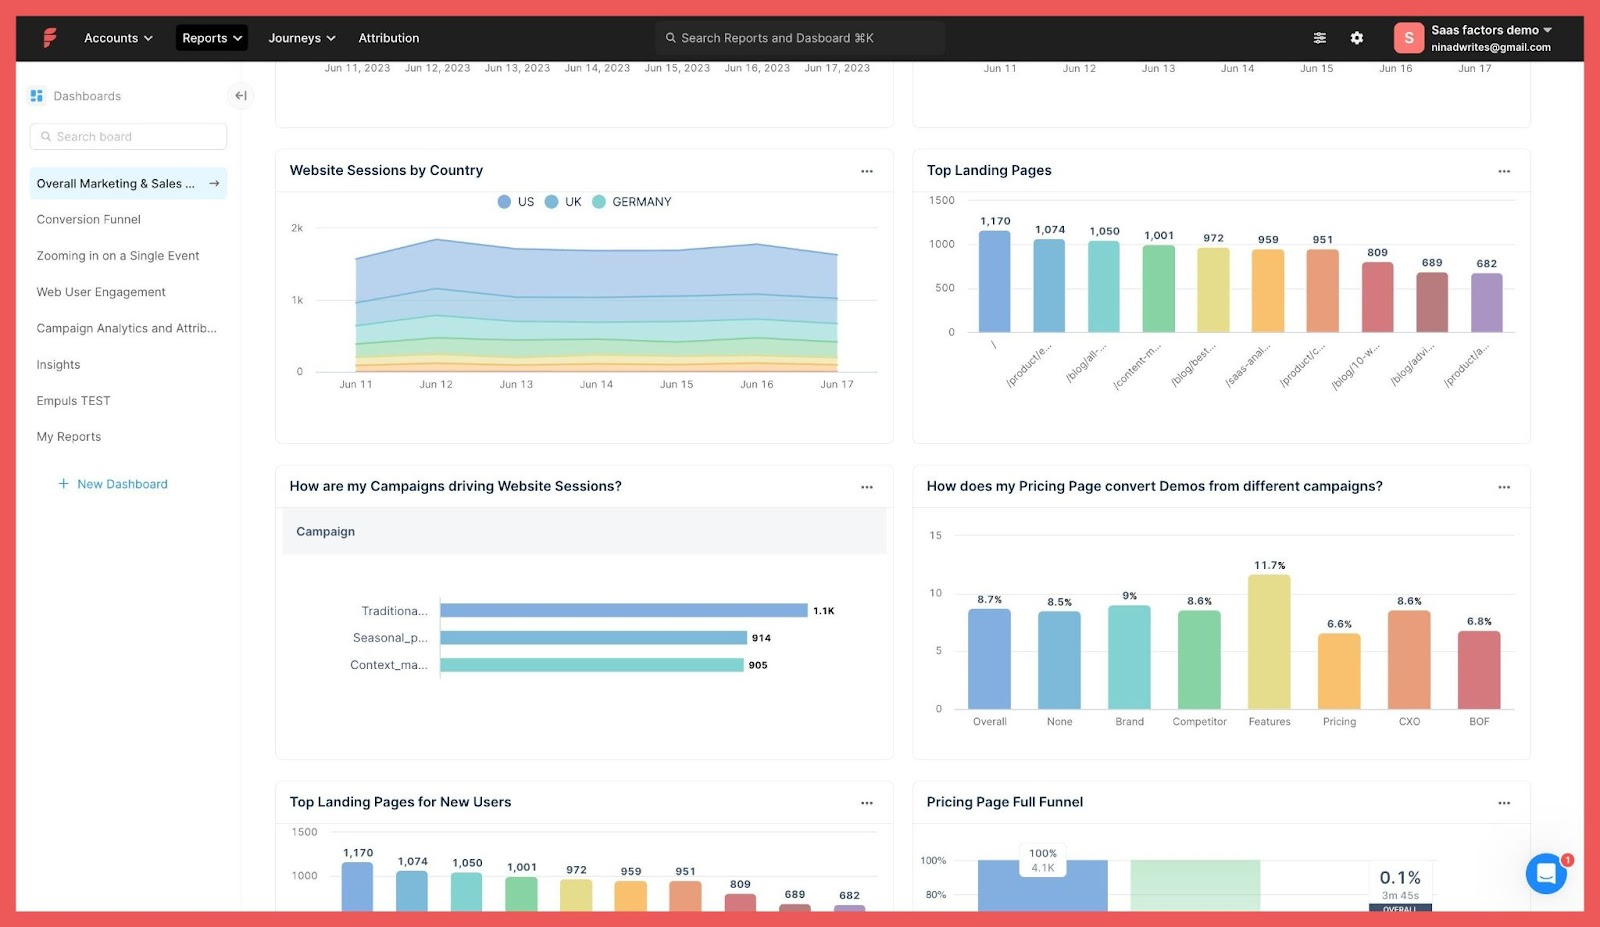
- Automate updates. Don’t force manual report refreshing. It should happen automatically through platforms like Factors or Klipfolio.
Step 4: Pipe In Your Data
Now that your content marketing is in place, it’s time to pipe your data to the right tools and optimize your strategies.
48% of marketers say that their top challenge in measuring content performance is the lack of integrated/correlated data from across their campaigns and marketing channels.
You need the right tools that help you bring together data:
- Factors.ai: Unifies analytics data and insights from across your marketing channels and gives you a single screen for all reporting and analytics needs.
- Google Analytics: Tracks website sessions, channels, geography, and other engagement data.
- SEMRush: Provides SEO metrics like rankings and backlinks.
- BuzzSumo: Analyzes social content shares and performance on social media.
You may also include your CRM tools in the mix for more comprehensive information on your customer’s stage in the buyer’s journey—and how you can better target them based on the info.
Here’s How Aviso’s Went from Data Gaps to Robust Account Insights
Aviso, an AI-driven revenue platform, struggled with fragmented data and limited customer insights before embracing Factors.
Relying only on Google Analytics, Aviso lacked a thorough understanding of user intent and account interactions. Without proper data, they couldn’t identify high-intent accounts engaging with their brand.
Factors provided the missing puzzle pieces. It helped Aviso:
- Gain deep insights into the buyer journey at both user and account levels
- Identify and engage with accounts demonstrating high intent
- Connect ad activities to downstream actions like form fills
- Quantify content’s impact on pipeline and revenue
With Factors, Aviso gained a clarity into which accounts engaged with their brand across channels. This sharpened their content strategy and helped convert high-value accounts into customers.
Making Optimal Data-Driven Decisions with Content Marketing Reports and Dashboards
With reporting rolled out, we need to put those insights into action. Here’s how we’d go about it.
Begin Finding Optimization Opportunities
Regularly review dashboards to locate areas ripe for optimization testing. Low-performance metrics indicate opportunities.
For example, you may find your most shared content has a high exit rate. That signals visitors don’t feel the content delivers on the headline’s promise. Time to refresh your content and write content that people love to read.
Jump on these openings to iteratively improve.
Scale Top-Performing Initiatives
Use dashboards to double down on specific channels, campaigns, and content that drive outsized results.
If LinkedIn conversion rates crush Facebook, shift more budget to LinkedIn. If long-form posts perform well, produce more of them.
Invest resources where they’ll have maximum impact.
Refine Strategies Based on Historical Data
Analyze historical reporting when planning future initiatives. See which past efforts drove the highest return to shape next quarter’s plans.
For example, you may find gated offers outperformed ungated content. Use that insight to guide your next campaign’s design.
Basing decisions on hard data is far more effective than hunches, especially when it comes to content marketing considering how long it takes to show ROI.
Increase Collaboration Across Teams
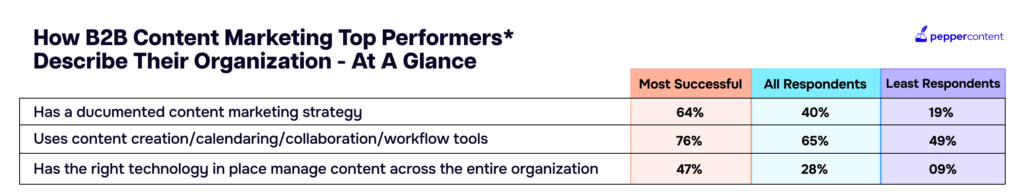
Share dashboards to align Sales, Marketing, and Revenue around content’s impact on shared goals. 76% of organizations that are most successful with their content marketing report using content creation and collaboration tools to bring everyone onboard.
When everyone sees value, they’re motivated to nurture and promote.
Collaboratively brainstorm campaigns, review results, and keep optimizing together. Accurate reporting builds bridges.
Next, let’s explore the tools and templates to enable all this optimization.
Content Marketing Reporting & Dashboard Tools To Get You Started
Now that we’ve covered dashboard design strategies, let’s discuss the technology enabling it all.
Here are some leading platforms for tracking content marketing data:
1. Pepper Content
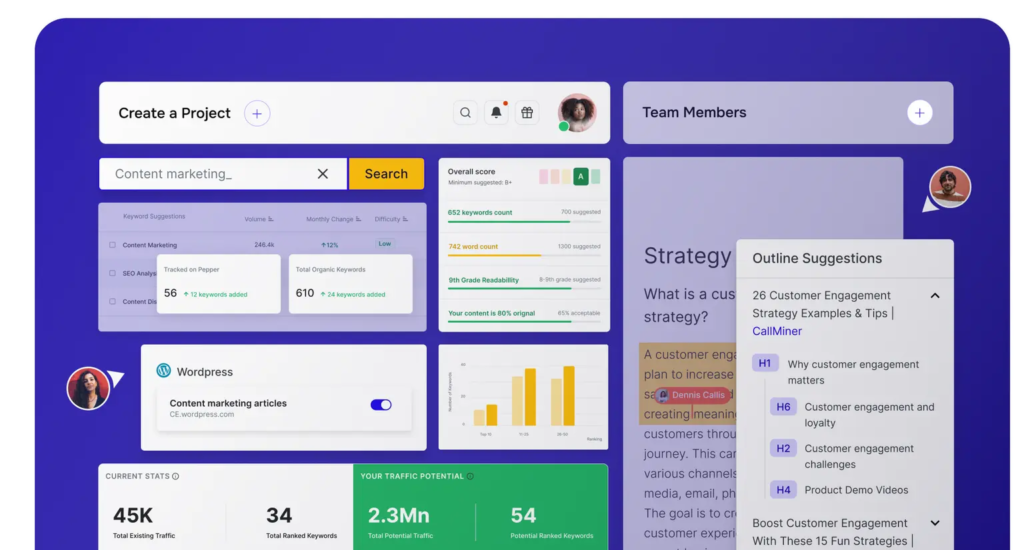
Pepper Content is a full-service content creation, distribution, and analytics platform that lets you grow your business with minimal intervention. Main benefits include:
- Content strategy: Let experts handle your content strategy so you can focus on improving your product
- Content creation: Pepper extends your marketing team with a pool of vetted writers to help you create content at scale
- Analytics and optimization: Keep track of your content performance and identify the missing pieces with the help of AI
2. Factors
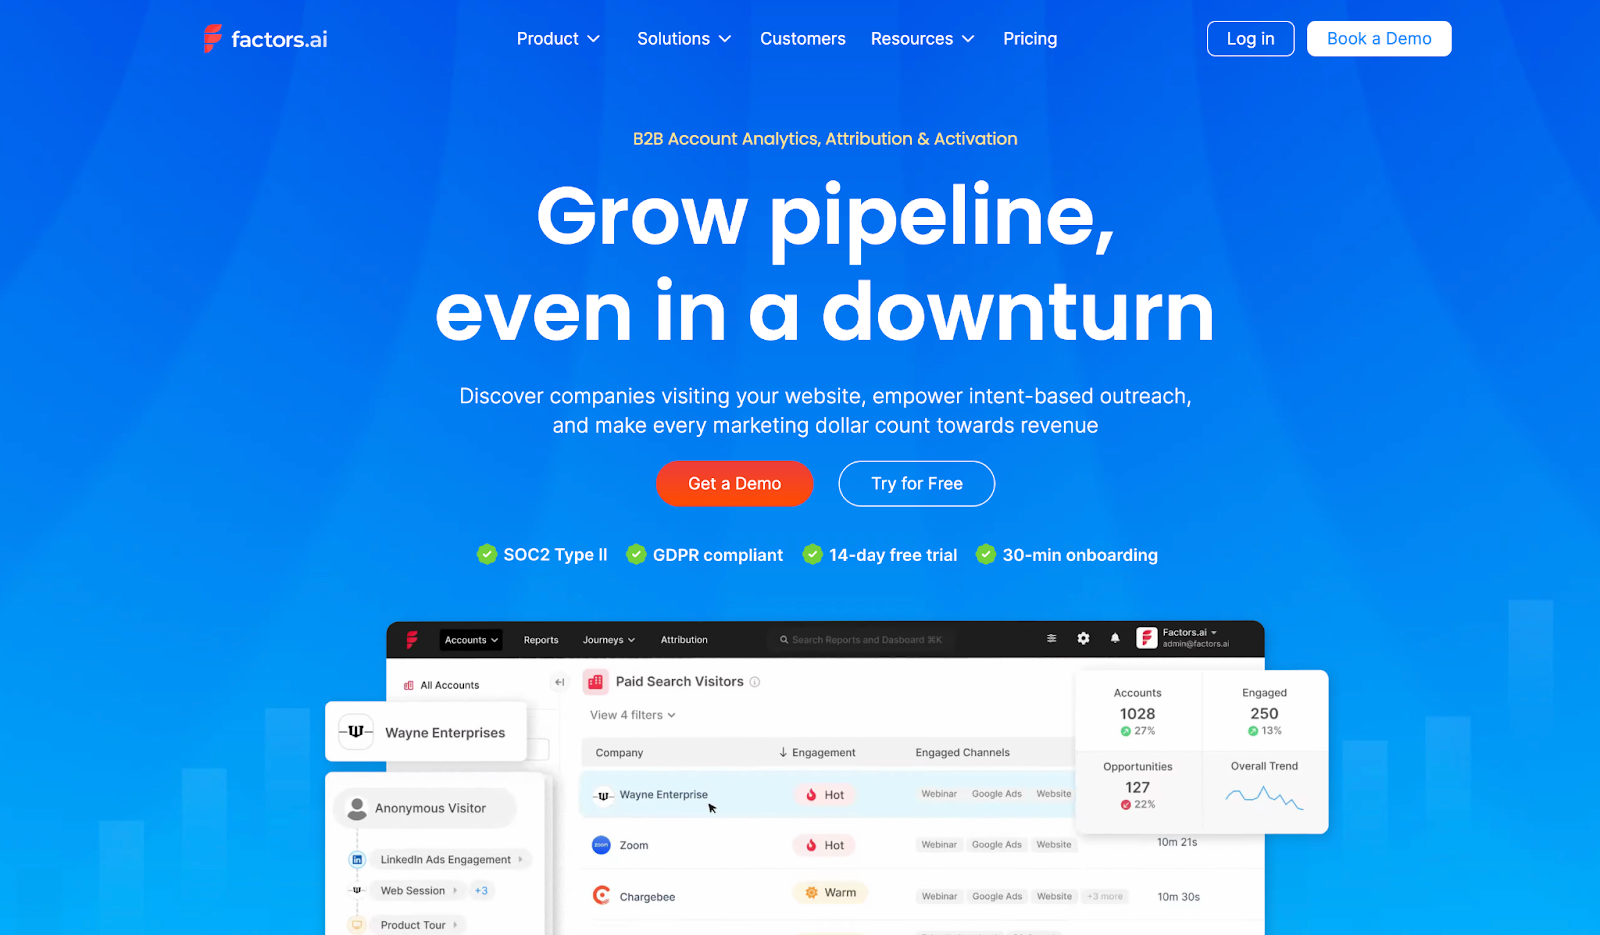
Factors provides unified marketing analytics to track performance from clicks to revenue from across all your marketing channels on a single screen. Benefits include:
- Unified data: Connect all your marketing tools automatically
- Revenue attribution: Quantify content’s pipeline and revenue influence
- Lead scoring: Automatically identify leads that are most likely to convert
- Custom reporting: Build unlimited custom dashboards without Dev help
- Predictive analytics: Machine learning reveals optimization opportunities
Trusted by leading SaaS brands like Clearfeed, Mailmodo, and Klenty.
3. Google Analytics
Google Analytics is an extremely powerful website analytics tool that helps you gain detailed insights about:
- Traffic volume and trends
- Top pages and content
- Channel and source breakdown
- Geographical data
- Site speed metrics
- Goals and conversions
While Google Analytics excels at engagement data, it does lack attribution features. Use it alongside other tools.
4. SEMRush
SEMRush and Ahrefs are two of the most popular SEO and content research tools out there. You can choose either one of them for:
- Keyword rankings across search engines
- Competitor content benchmarking
- Backlinks driving traffic
- Content gaps around valuable keywords
While there are differences in how Ahrefs and SEMRush display and calculate metrics, both are great for content marketing reporting and analytics—the major deciding factor being the pricing.
5. BuzzSumo
BuzzSumo is an excellent tool for brands that are active on social media. It helps you identify the latest trending topics, and capitalize on them by helping you plan things out.
BuzzSumo also helps you track:
- Total and social shares by content piece
- Influencers sharing your content
- Competitor social performance
- High-performing topics and formats
Conclusion
Content marketing is rapidly evolving into a growth lever for B2B companies. But shooting in the dark leads nowhere. You need visibility into what content works—and what doesn’t.
The answer to this problem is content marketing analytics and reporting.
With the right tools to create reports and dashboards, every content effort contributes to a shared goal. Teams align around moving metrics in the right direction. And you can confidently scale initiatives that drive disproportionate results.
Remember, you can’t improve what you don’t measure. Follow the blueprint in this guide to build a command center quantifying content’s impact.
The key is starting with the metrics aligned to business goals, choosing the right tools, and designing for maximum clarity.
So, start tracking what matters and turn your content into a pipeline and revenue powerhouse.
Book a demo with Pepper Content and Factors and see how these tools can upgrade your content marketing.
Latest Blogs
Explore how Google’s 2025 AI search updates triggered ranking chaos. Learn actionable strategies to adapt your SEO for AI Overviews, zero-click searches, and SERP volatility. Stay ahead now.
Learn how to rank on AI search engines like ChatGPT, Perplexity, and Gemini by optimizing your content for authority, structure, and relevance. Stay ahead in AI-driven search with this strategic guide.
Explore the best healthcare SEO services for your medical practice. Improve online visibility and effectively reach more patients in need of your services.
Get your hands on the latest news!

Similar Posts

Guest Post
4 mins read
5 Employee Management Software You Should Know About

Freelancing 101
5 mins read
6 Tips for Surviving the Freelance Ecosystem and Reducing Burnout

Guest Post
6 mins read